About Diplyzer
Diplyzer is the AI Research Agent for Financial Markets — one prompt delivers a full institutional-grade analysis: technical, fundamental, sentiment, and alternative data synthesized into a complete research report.
Diplyzer is the AI Research Agent for Financial Markets — one prompt delivers a full institutional-grade analysis: technical, fundamental, sentiment, and alternative data synthesized into a complete research report.
Every morning, millions of traders open their laptops and face the same exhausting ritual: fourteen browser tabs, three charting platforms, a spreadsheet, a news feed, and two social media apps — all before the market even opens.
One tab for price action. Another for fundamentals. A third to check what insiders are buying. A fourth for sentiment. A fifth to run a technical scan. By the time the analysis is assembled, the move has already happened.
Diplyzer was built to destroy that ritual.
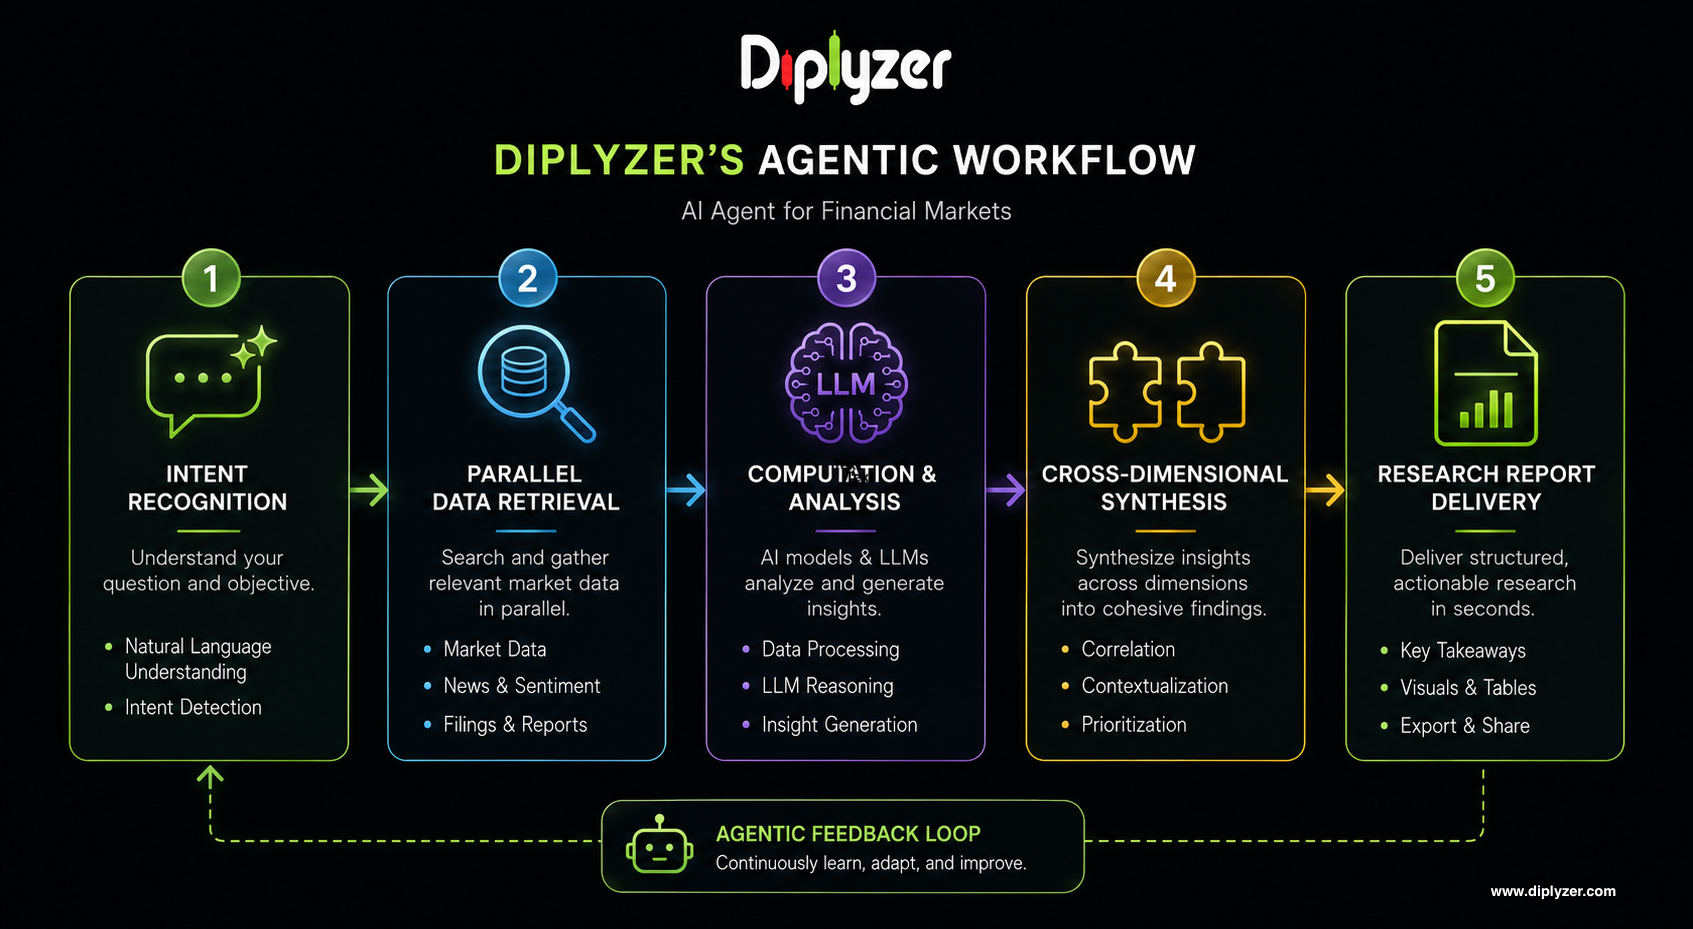
Diplyzer is a Deep Research AI Agent for Financial Markets. It is not a chatbot that answers one question at a time. It is not a static dashboard. It is a research engine that thinks across every dimension of the market simultaneously.
You describe what you want to understand — a stock, a setup, a sector, a macro event. Diplyzer's AI agent deploys a full research workflow behind the scenes: retrieving real-time and historical data, running technical computations across multiple timeframes, scanning for chart patterns, pulling insider and institutional filings, synthesizing news and social media sentiment — and returns a complete, interactive research report in one response.
One prompt. Full analysis. Institutional depth.
Not one data point — a synthesis. Not a search result — a rigorous quantitative overview.
1. Information Fragmentation
The data exists: real-time prices, historical patterns, insider filings, economic calendars, earnings transcripts, options flow, sentiment scores. But it is scattered across dozens of platforms, formats, and paywalls. Assembling a complete picture for a single research thesis takes hours. Diplyzer collapses all of it into a single conversational interface.
2. The Research Depth Gap
Markets generate noise at industrial scale. The hardest part of market research is synthesizing multi-factor confluence: the chart structure, the fundamental financial health, institutional filings, and the macro backdrop all aligning. Diplyzer synthesizes all four in a single quantitative summary.
3. The Speed Deficit
By the time an analyst manually runs a pattern scan, cross-checks insider filings, reads the latest earnings call, and checks current news sentiment — the opportunity is gone. Speed is essential. Diplyzer compresses a full multi-dimensional research session into a single request, delivering in seconds what used to take hours.
Diplyzer is built for everyone who makes decisions based on market data:
Diplyzer covers every major asset class through a single conversational interface:
| Asset Class | Coverage |
|---|---|
| US Stocks | NYSE, NASDAQ, AMEX — real-time quotes, full financials, patterns |
| International Stocks | LSE, TSX, ASX, XETRA, HKSE, JPX, BSE, NSE and more |
| Cryptocurrencies | Real-time quotes, historical data, candlestick patterns, sentiment |
| Forex | Major currency pairs — real-time and historical, full pattern detection |
| Commodities | Real-time quotes, historical OHLCV, contract details |
| ETFs & Mutual Funds | Holdings, sector exposure, expense ratios, NAV, AUM |
| Indices | S&P 500, Nasdaq, Dow Jones, constituents, historical returns |
When you send Diplyzer a research request, it executes a complete, multi-step analytical workflow — not a keyword lookup, but a structured investigation:
Every output is built from scratch for your specific question. No cached summaries. No generic answers. A complete, custom analysis every time.
| Capability | Diplyzer | Bloomberg | Generic AI Chatbots |
|---|---|---|---|
| Conversational AI interface | ✅ | ❌ | ✅ (but no market data) |
| Real-time multi-asset data | ✅ | ✅ | ❌ |
| Smart Money Concepts automation | ✅ | ❌ | ❌ |
| Chart pattern detection | ✅ | ❌ | ❌ |
| Insider & congressional trading | ✅ | ✅ | ❌ |
| Harmonic pattern detection | ✅ | ❌ | ❌ |
| Live web & social search | ✅ | ❌ | Partial |
| Price | Accessible SaaS | $24,000/year | $20/mo |
Bloomberg costs $24,000 per year and requires weeks of training. Generic AI chatbots hallucinate stock prices and cannot execute real quantitative computations. Diplyzer is built to bridge this gap, synthesizing technical, fundamental, and alternative data in the same response.
Diplyzer gives every trader and analyst a full research team in their pocket — one that retrieves real data, runs real computations, synthesizes every market dimension, and delivers a complete analysis in seconds.
Here are some examples of how traders and analysts use Diplyzer every day:
"Analyze Tesla's last 6 months of price action. Show me the key support and resistance levels, the current RSI reading, and whether a Cup and Handle pattern is forming."
"Find all insider purchases over $1 million in the last 60 days. For each company, show me the Piotroski F-Score, the latest analyst consensus, and current price versus intrinsic value."
"Pull the current Treasury yield curve and compare it to 6 months ago. Which sectors are rotating into leadership right now?"
"Search X (Twitter) for recent sentiment on Solana. Display the 4-hour technical chart showing moving average alignment and key resistance levels."
Ready to turn your market questions into market intelligence?
Start with our Getting Started Guide to learn how to frame questions, interpret outputs, and explore Diplyzer's full analytical power.
Then explore our topic guides: