Getting Started with Diplyzer
Learn how to use Diplyzer's AI research agent — how to frame research requests, interpret multi-dimensional analytical outputs, and run your first full market analysis in minutes.
Learn how to use Diplyzer's AI research agent — how to frame research requests, interpret multi-dimensional analytical outputs, and run your first full market analysis in minutes.
Welcome to Diplyzer. This guide will walk you through everything you need to know to run deep, institutional-grade market research in minutes — through a single natural language prompt.
Diplyzer is not a chatbot you query one fact at a time. It is a research agent that receives your research intent, deploys a full analytical workflow, and returns a complete multi-dimensional report. One prompt. Full analysis.
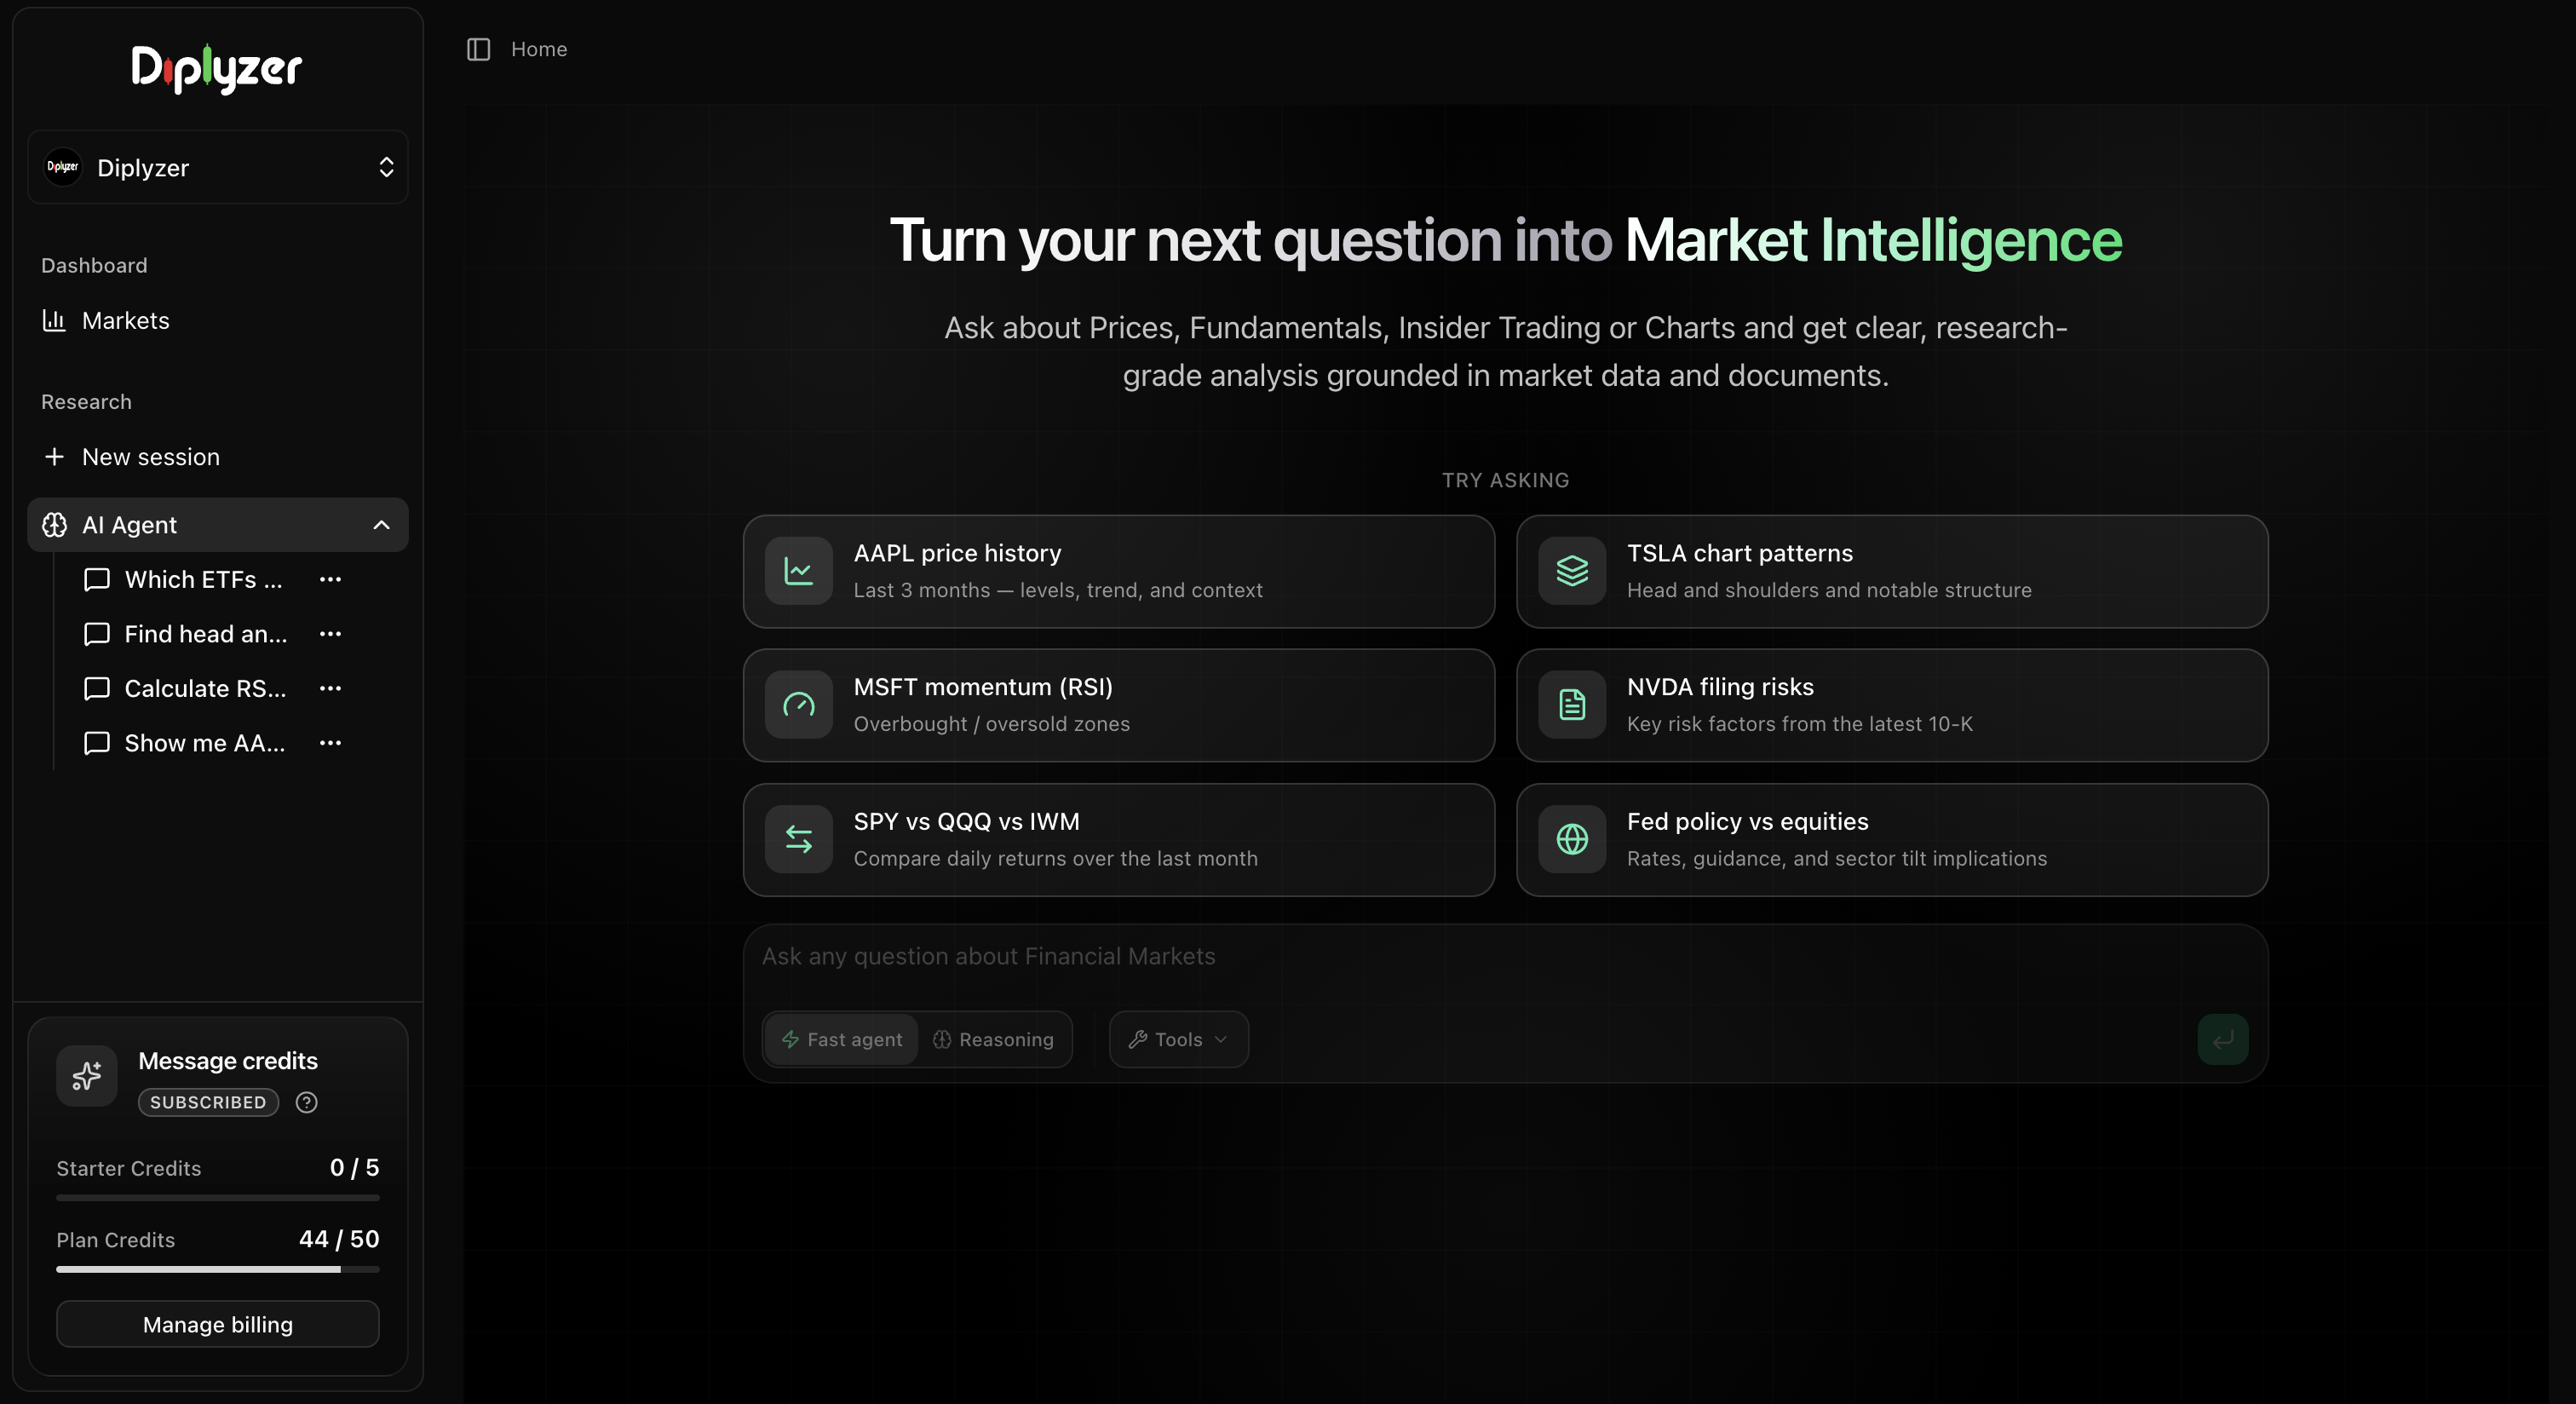
Once you create your account, you will land in your Workspace — the main interface where all your market conversations happen.
The workspace is organized around a single principle: you ask questions, Diplyzer delivers analysis. There are no complex menus to navigate, no dashboards to configure, and no settings to wrestle with.
A few things to familiarize yourself with:
The most important skill in using Diplyzer is knowing how to describe your research intent. Unlike rigid software tools that require menu navigation, Diplyzer understands natural language — and the more context you give it, the richer and more complete the analysis you receive.
Think of each message as briefing a research analyst: tell them what you want to understand, about which asset, and at what scope or timeframe. Diplyzer handles everything else.
A strong request tells Diplyzer three things:
Examples of high-quality research requests:
"Deep analysis of Apple over the last 3 months: technical chart with all key indicators, current fundamental health (F-Score, margins, FCF), latest insider activity, and analyst consensus. Summarize the overall thesis."
"I want to understand Microsoft's current investment case: valuation vs. peers, earnings growth trend, institutional 13F activity changes in the last quarter, and technical structure on the daily chart."
"Scan the S&P 500 for the best candidate assets right now: stocks in an uptrend pulling back to key support, with a Piotroski F-Score above 6 and no earnings in the next 14 days. Rank by factor confluence."
"Full pre-market briefing: futures direction, top pre-market movers with catalysts, economic releases today, and key SPY levels to watch."*
Diplyzer generates different types of outputs depending on what you ask for. Here is a guide to each:
When you ask for technical analysis, Diplyzer renders full interactive candlestick charts with indicator overlays. You can hover over any candle to see its exact OHLCV values, zoom into specific time ranges, and toggle overlays on and off.
Charts include:
For comprehensive analyses, Diplyzer generates dashboards combining everything into a unified view.
Diplyzer always accompanies visual outputs with a clear written analysis that explains what the data means, what market factors are present, and what context is relevant. This is the synthesis that turns raw data into structured market intelligence.
For fundamental queries, market movers, insider trades, or financial metrics, Diplyzer returns structured data tables with all the relevant information organized clearly.
Diplyzer is most powerful when you treat each session as a progressive research investigation rather than isolated questions. Each response is a starting point you can deepen, compare, or extend.
Example research progression:
"Full technical and fundamental analysis of NVIDIA: chart setup, RSI, MACD, key levels, Piotroski F-Score, revenue growth, margins, and next earnings date."
Diplyzer returns a complete multi-dimensional report. Now go deeper:
"Compare NVIDIA's valuation to AMD and Intel. Which is cheapest on P/E and EV/EBITDA?"
Then add the intelligence layer:
"Any insider buying or large institutional 13F changes in NVIDIA in the last quarter?"
Then inspect key technical levels:
"Based on the technical chart and volume profile, what are the key historical support/resistance levels and volatility bands?"
Each request builds a complete, data-backed research thesis — from initial screening to an institutional-grade brief.
Start with a full multi-dimensional request. Instead of "tell me about Tesla," say: "Full analysis of Tesla: technical chart setup (3-month daily), current fundamental health, any insider activity in the last 60 days, and analyst consensus. What does the complete picture say?" This is where Diplyzer's depth becomes immediately visible.
Layer research dimensions. Ask for technical, then fundamental, then market intelligence, then synthesis. Or combine them in a single comprehensive request — both work.
Ask for comparisons. Diplyzer excels at comparative analysis. Try: "Compare the fundamental quality and technical metrics of Apple, Microsoft, and Google. Which has the highest Piotroski F-Score and lowest multiple relative to its historical mean?"
Use it as a research partner. Describe what you want to understand, not just what you want to see. "Analyze the bullish and bearish factors for [stock] right now. Cover technical indicators, fundamental quality, market intelligence, and sentiment."
Combine asset classes. Ask about correlations between the Dollar Index and gold, how Treasury yields are affecting growth stocks, or how Bitcoin's dominance trend affects altcoin positioning. Diplyzer handles multi-asset synthesis naturally.
Here are some great first questions to get you started immediately:
"Give me a summary of how the major US indices performed this week, including the biggest sector movers."
"Analyze [your favorite stock] over the last 3 months. Include technical indicators, recent news, and current analyst ratings."
"Scan Large-Cap S&P 500 stocks ($10B+ market cap) with positive free cash flow that are showing a Bull Flag or Cup and Handle pattern right now."
"What is [company name]'s current P/E ratio, revenue growth, and free cash flow? How does it compare to its sector?"
"What is the market sentiment around [company name] based on the latest news and analyst activity?"
"Show me the most significant insider stock purchases in the last 30 days. For each company, show the Piotroski F-Score and whether institutions have also been buying."
Now that you understand how Diplyzer works, explore the topic guides to master specific research domains: