Most investors believe they are diversified. Most investors are wrong.
Holding 20 stocks in 8 sectors feels like diversification. But if those 20 stocks share the same underlying factor exposures — all momentum stocks, all high-beta growth names, all highly correlated to the same macro regime — they will move together when conditions change. And when they do, the portfolio that looked diversified will behave like a single concentrated bet.
True diversification is one of the most valuable and most misunderstood concepts in all of investing.
What Diversification Actually Does
Diversification is the practice of combining assets that don't move perfectly together, reducing the portfolio's overall volatility without proportionally reducing its expected return.
The mathematical foundation: If you hold two assets that are uncorrelated (correlation = 0), the combined portfolio has lower volatility than either asset alone — even if both individually have the same risk. If you hold two assets that are negatively correlated (correlation = -1), the portfolio volatility drops toward zero.
The practical reality: Perfect negative correlation doesn't exist between equities. But even partial diversification — combining assets with correlations well below 1.0 — meaningfully reduces portfolio volatility.
The diversification paradox: Every stock you add to a portfolio reduces its idiosyncratic (company-specific) risk, but also adds it to the pool of systematic (market-level) risk. Beyond approximately 20–30 well-chosen stocks, the marginal diversification benefit becomes nearly zero. You cannot diversify away systemic risk by simply adding more stocks.
Correlation: The Core Metric
Correlation measures how closely two assets move together, on a scale from -1 to +1:
| Correlation | Meaning |
|---|
| +1.0 | Perfect positive correlation — move identically |
| +0.7 to +0.9 | High positive — move mostly together |
| +0.3 to +0.6 | Moderate — some independent movement |
| 0 | Uncorrelated — completely independent |
| -0.3 to -0.6 | Moderate negative — tend to move opposite |
| -1.0 | Perfect negative — move exactly opposite |
What you want in a portfolio: A mix of positions with correlations well below +0.7. Holding ten stocks with +0.9 mutual correlations is not significantly better than holding one of them.
Correlation Changes Over Time
One of the most dangerous portfolio risk illusions: correlations that look low during normal markets spike dramatically during stress events.
During the 2008 financial crisis, 2020 COVID crash, and 2022 rate shock, correlations across virtually all equity sectors surged toward 1.0. The diversified-looking equity portfolio became highly correlated precisely when diversification was most needed.
Stress correlation: For risk management, use the correlation observed during the last 2–3 significant market corrections, not the average correlation over full market cycles.
AI Prompt
"Calculate the pairwise correlations between my current portfolio holdings [list] over the last 12 months. Then show me how those correlations changed during the last significant market selloff. Where are my hidden correlation clusters?"
Types of Diversification
Asset Class Diversification
The most fundamental level — owning different types of assets:
| Asset Class Pair | Normal Correlation | Crisis Correlation |
|---|
| US Equities / Bonds | -0.2 to +0.3 | Variable — has broken down in inflationary regimes |
| Equities / Gold | -0.1 to +0.2 | Often negative (safe haven demand) |
| Equities / Real Estate | +0.4 to +0.6 | Can spike toward +0.8 |
| Equities / Commodities | +0.1 to +0.4 | Often defensive during equity stress |
Important caveat: The traditional equity-bond negative correlation — the foundation of the 60/40 portfolio — broke down significantly in 2022 when inflation drove both asset classes down simultaneously. Asset class correlations are not stable across all market regimes.
Sector Diversification
Owning companies across multiple economic sectors reduces concentration in any single area of the economy. However, sector correlations within a given market direction can be high.
True sector diversification requires owning sectors with different cyclical profiles:
- Cyclical sectors (Technology, Consumer Discretionary, Industrials) tend to move together
- Defensive sectors (Utilities, Consumer Staples, Healthcare) move somewhat independently
- Commodity sectors (Energy, Materials) have different drivers from both
Owning only Technology, Consumer Discretionary, and Industrials is not a diversified portfolio — it's a concentrated bet on economic expansion.
Geographic Diversification
International markets offer exposure to different economic cycles, currencies, and political environments. However, the correlation between US and international equity markets has been rising over decades due to globalization.
- Developed international (EAFE): Correlation with US equities typically 0.7–0.85
- Emerging markets (EM): Correlation typically 0.6–0.75; more independent behavior but higher individual market volatility
- China A-shares: Among the most independent — correlation with US equities historically quite low
AI Prompt
"What is the current correlation between my US equity positions and international markets (EAFE, EM)? Am I getting meaningful geographic diversification, or are all my positions essentially moving with the S&P 500?"
Factor Diversification: The Hidden Concentration
This is the most sophisticated — and most overlooked — form of portfolio concentration. Even a portfolio with 30 stocks across 10 sectors can be massively concentrated in a single factor.
Common Factor Exposures
Market (Beta): How much does your portfolio move when the broader market moves? A portfolio with average beta of 1.5 is 50% more volatile than the market.
Size: Are your stocks mostly large-cap, mid-cap, or small-cap? Each has different return drivers and risk characteristics across the cycle.
Value vs. Growth: Are your holdings predominantly trading at high multiples (growth) or low multiples (value)? These factors rotate dramatically in and out of favor.
Momentum: Are your stocks mostly recent outperformers? Momentum portfolios look great until the factor reverses — and when momentum reverses, it reverses fast and hard.
Quality: Do your holdings have strong balance sheets and stable earnings, or are you concentrated in speculative, loss-making companies that are highly sensitive to credit conditions?
A common portfolio failure: A growth stock investor builds a 25-stock portfolio. Every stock is a high-quality business in a different sector. But all 25 are high-multiple growth companies, all loved by momentum traders, all with weak free cash flow currently being funded by cheap credit. This portfolio looks diversified by sector — but it is completely concentrated in the Growth and Momentum factors. When rates rise, every single holding falls simultaneously.
AI Prompt
"Analyze my portfolio [list positions] for factor exposures. What is the average P/E and P/S ratio of my holdings (growth vs. value tilt)? What is the weighted-average beta? What percentage of my holdings are classified as momentum stocks? Am I inadvertently concentrated in a single factor?"
Building a Portfolio That's Genuinely Diversified
The Diversification Checklist
Sector check: No sector above 25–30% of portfolio value.
Factor check: Deliberately include positions across multiple factor profiles — don't only own high-momentum growth. Include some value, some quality-dividend, some cyclicals.
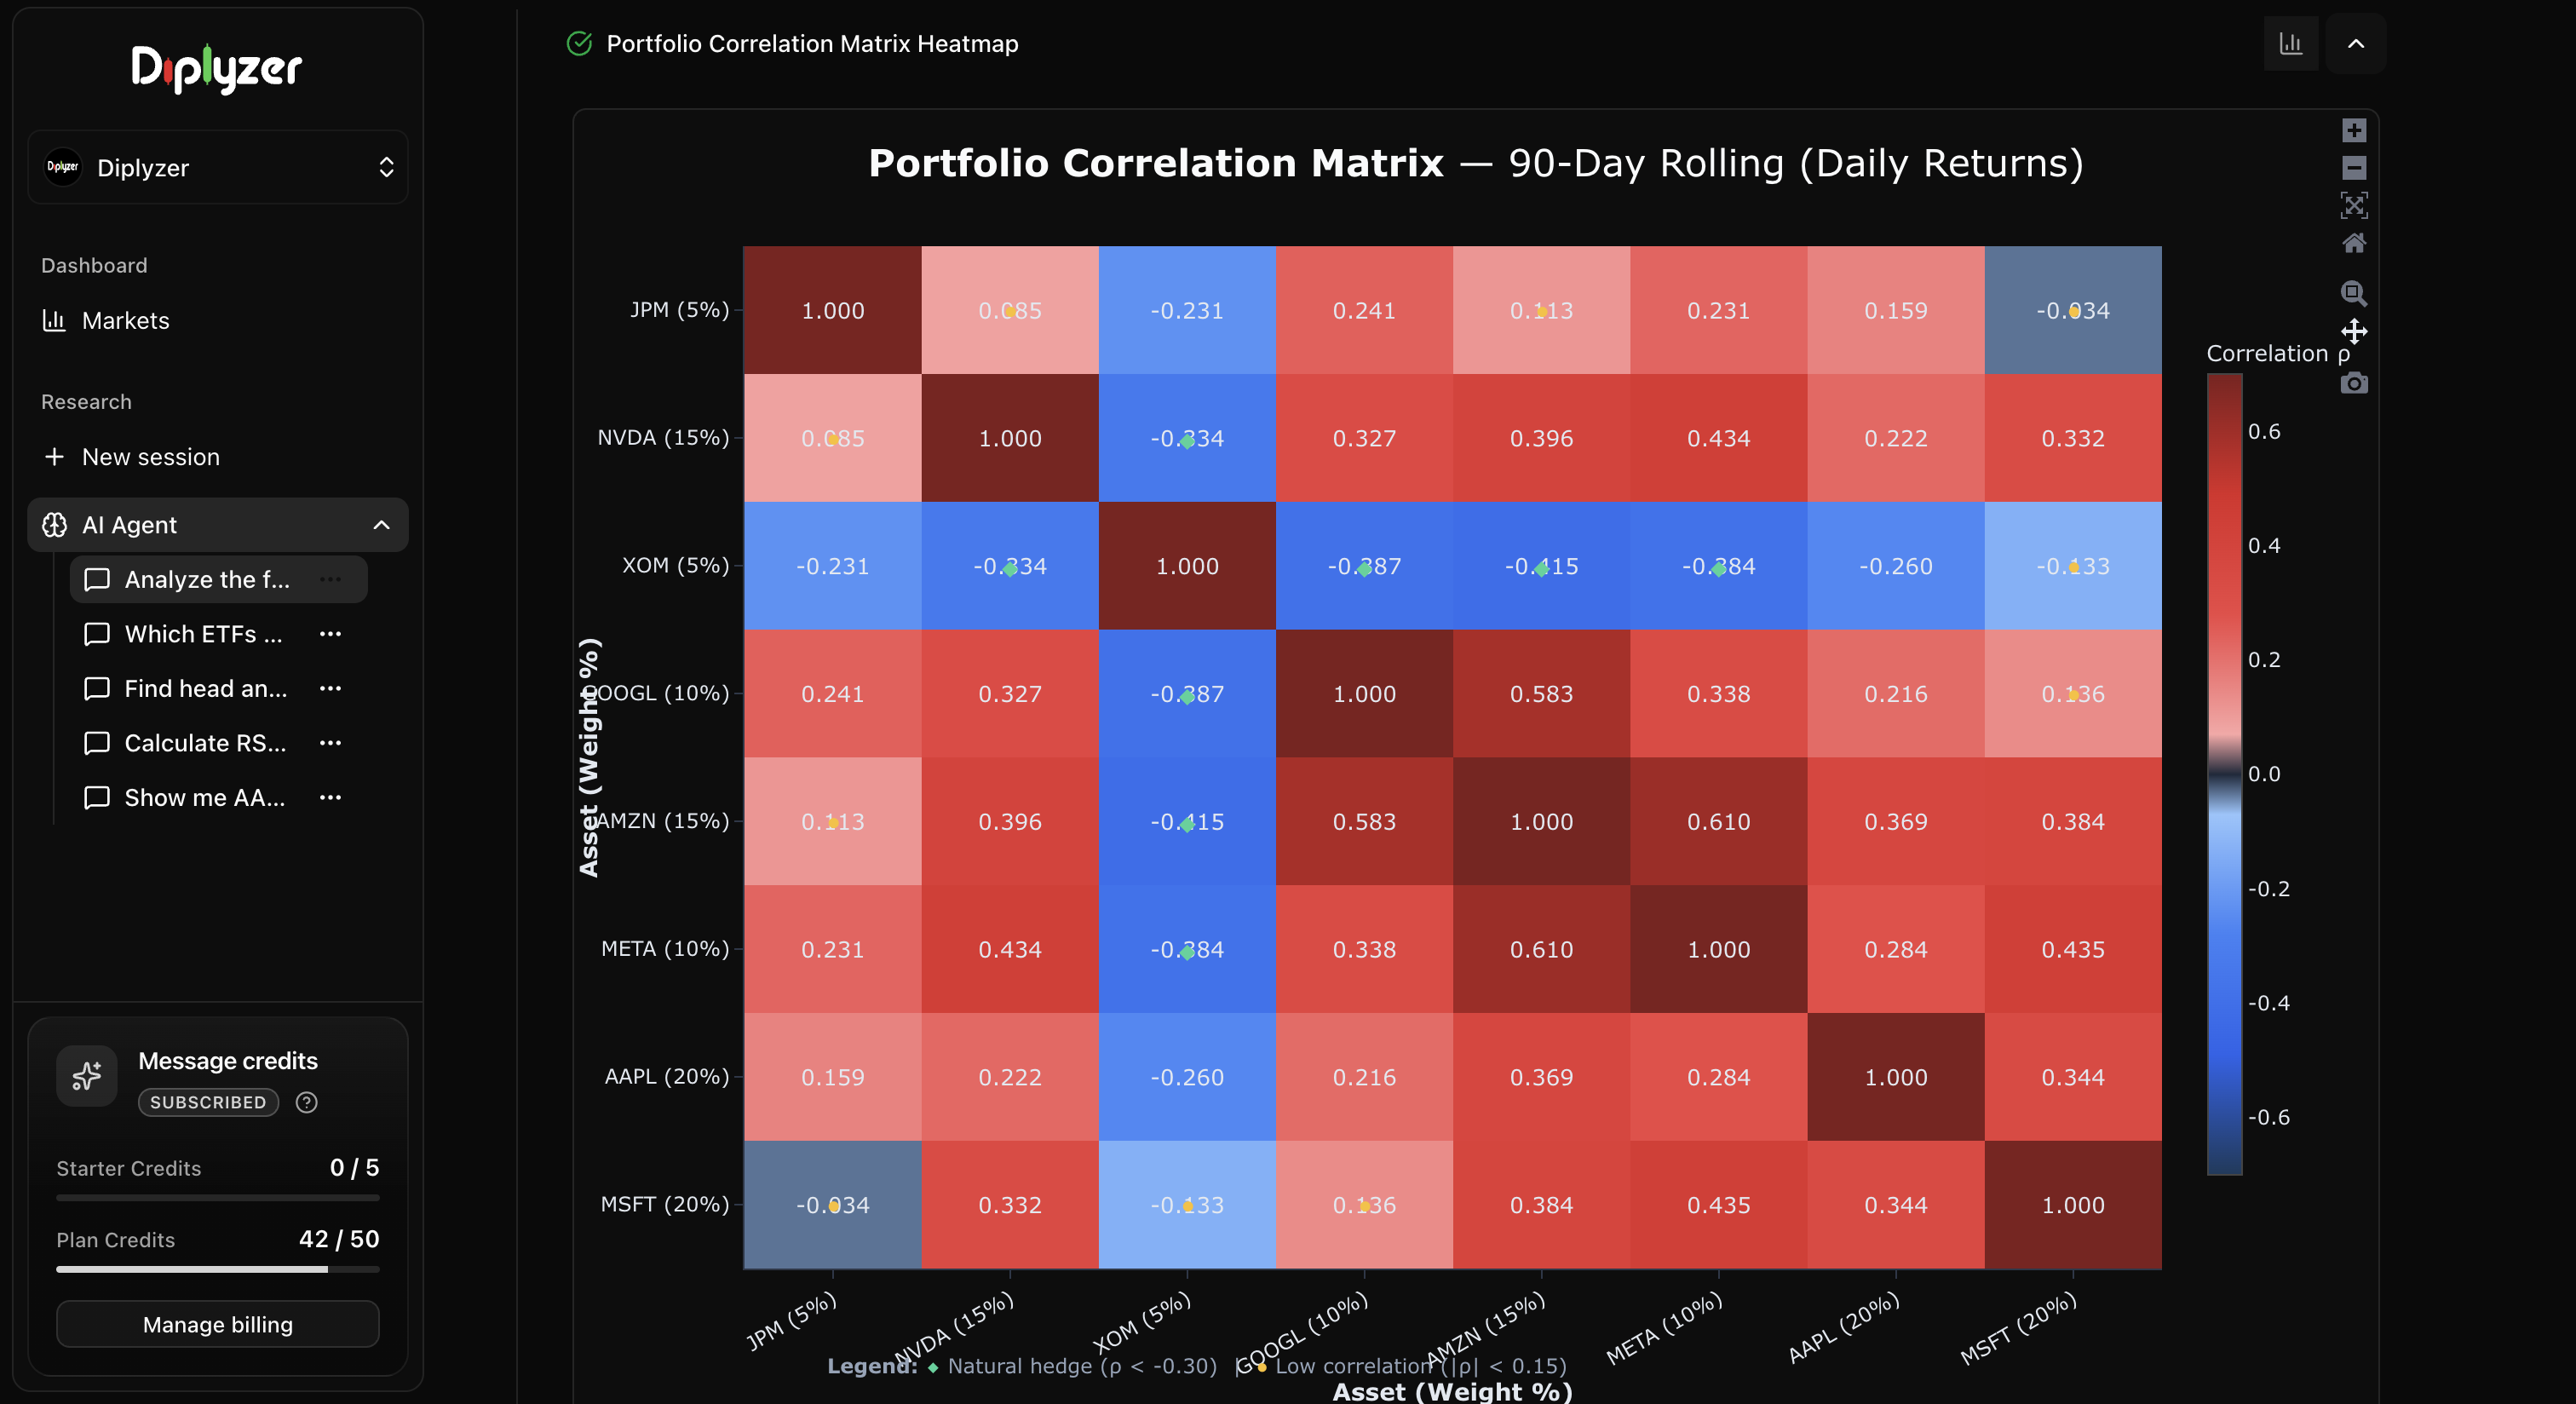
Correlation check: Calculate pairwise correlations. If your top 3 holdings all have correlations above 0.8 with each other, you are overconcentrated regardless of how many names you own.
Macro regime check: Would your portfolio perform well in both a rising rate environment AND a falling rate environment? In both strong growth AND slow growth? If not, you are implicitly making a macro bet.
Stress test: Look at your portfolio's correlation during the last 3 major selloffs. How did your "diversified" portfolio actually behave when markets fell?
Genuine Diversifiers
These asset classes and strategies have demonstrated the most independence from equity market returns during stress periods:
- Long-duration Treasuries (in deflationary downturns, not inflationary)
- Gold (safe haven in uncertainty; negatively correlated with real yields)
- Managed futures (trend-following CTAs): One of the most reliable genuine diversifiers — tends to profit during both equity bull markets and bear markets
- Short volatility strategies (during calm markets) vs. long volatility (during stress)
- Merger arbitrage: Return driven by deal completion, not market direction
Correlation Monitoring in Practice
Correlation is not static — it should be monitored continuously:
AI Prompt
"Run a rolling 90-day correlation analysis on my current portfolio holdings [list]. Show me which positions have seen their correlation to each other increase the most over the last 3 months. Are there any new correlation clusters forming that represent emerging concentration risk?"
AI Prompt
"My portfolio lost [X]% during last month's market selloff. Analyze which holdings contributed most to the loss and whether they moved together (suggesting hidden correlation) or independently. What does this tell me about my true diversification?"