Most investors build portfolios by accident — buying stocks they find interesting, accumulating positions without a framework, and ending up with a collection of holdings that have no coherent structure or risk management philosophy. The result is a portfolio that is hard to analyze, hard to manage, and often far riskier than it appears.
Intentional portfolio construction is the antidote. It starts with a clear framework and results in a portfolio where every position serves a defined purpose within a deliberate structure.
Step 1: Define Your Investment Philosophy
Before buying a single position, you need a clear, written investment philosophy. This is not abstract — it is the operating manual for every decision you will make.
Key questions to answer:
What is my time horizon? Day traders need different portfolio structures than swing traders, who need different structures than long-term investors. Time horizon determines everything from position sizing to stop placement to the type of analysis that matters.
What is my primary edge? Are you better at: fundamental research and identifying undervalued businesses? Technical analysis and reading price action? Macro analysis and positioning across asset classes? Your portfolio should be built around your actual edge, not a theoretical one.
What is my risk tolerance? Not emotionally ("I can handle volatility") but mathematically: what is the maximum peak-to-trough drawdown I can sustain without making emotional decisions? 10%? 20%? 30%? This number determines your maximum position sizes and overall portfolio leverage.
What is my return objective? Realistic return targets determine how much risk you need to take. If you need 30% annual returns, you will need to concentrate and use leverage. If 12–15% is sufficient, you can build a diversified, lower-volatility approach.
Step 2: Asset Allocation Framework
Asset allocation — how you divide capital across major asset classes — is the single most important determinant of long-term portfolio performance. Studies consistently show that asset allocation explains 90%+ of the variation in portfolio returns across time.
Strategic Asset Allocation
Your baseline, long-term target allocation across asset classes:
| Asset Class | Conservative | Moderate | Aggressive |
|---|
| US Equities | 30% | 50% | 70% |
| International Equities | 10% | 15% | 15% |
| Fixed Income | 40% | 20% | 5% |
| Alternatives (Commodities, REITs) | 10% | 10% | 5% |
| Cash | 10% | 5% | 5% |
These are starting points. Your actual allocation should reflect your time horizon, risk tolerance, and current market conditions.
Tactical Asset Allocation
Tactical allocation involves making temporary deviations from your strategic baseline when specific opportunities or risks emerge. For example:
- Reducing equity exposure in late-cycle environments (when leading indicators signal recession risk)
- Increasing commodity allocation when inflation is rising
- Raising cash during high-VIX periods when opportunities are scarce
Tactical allocation should be bounded — deviating no more than 10–20% from your strategic baseline in any single direction. Larger deviations become speculation on market timing.
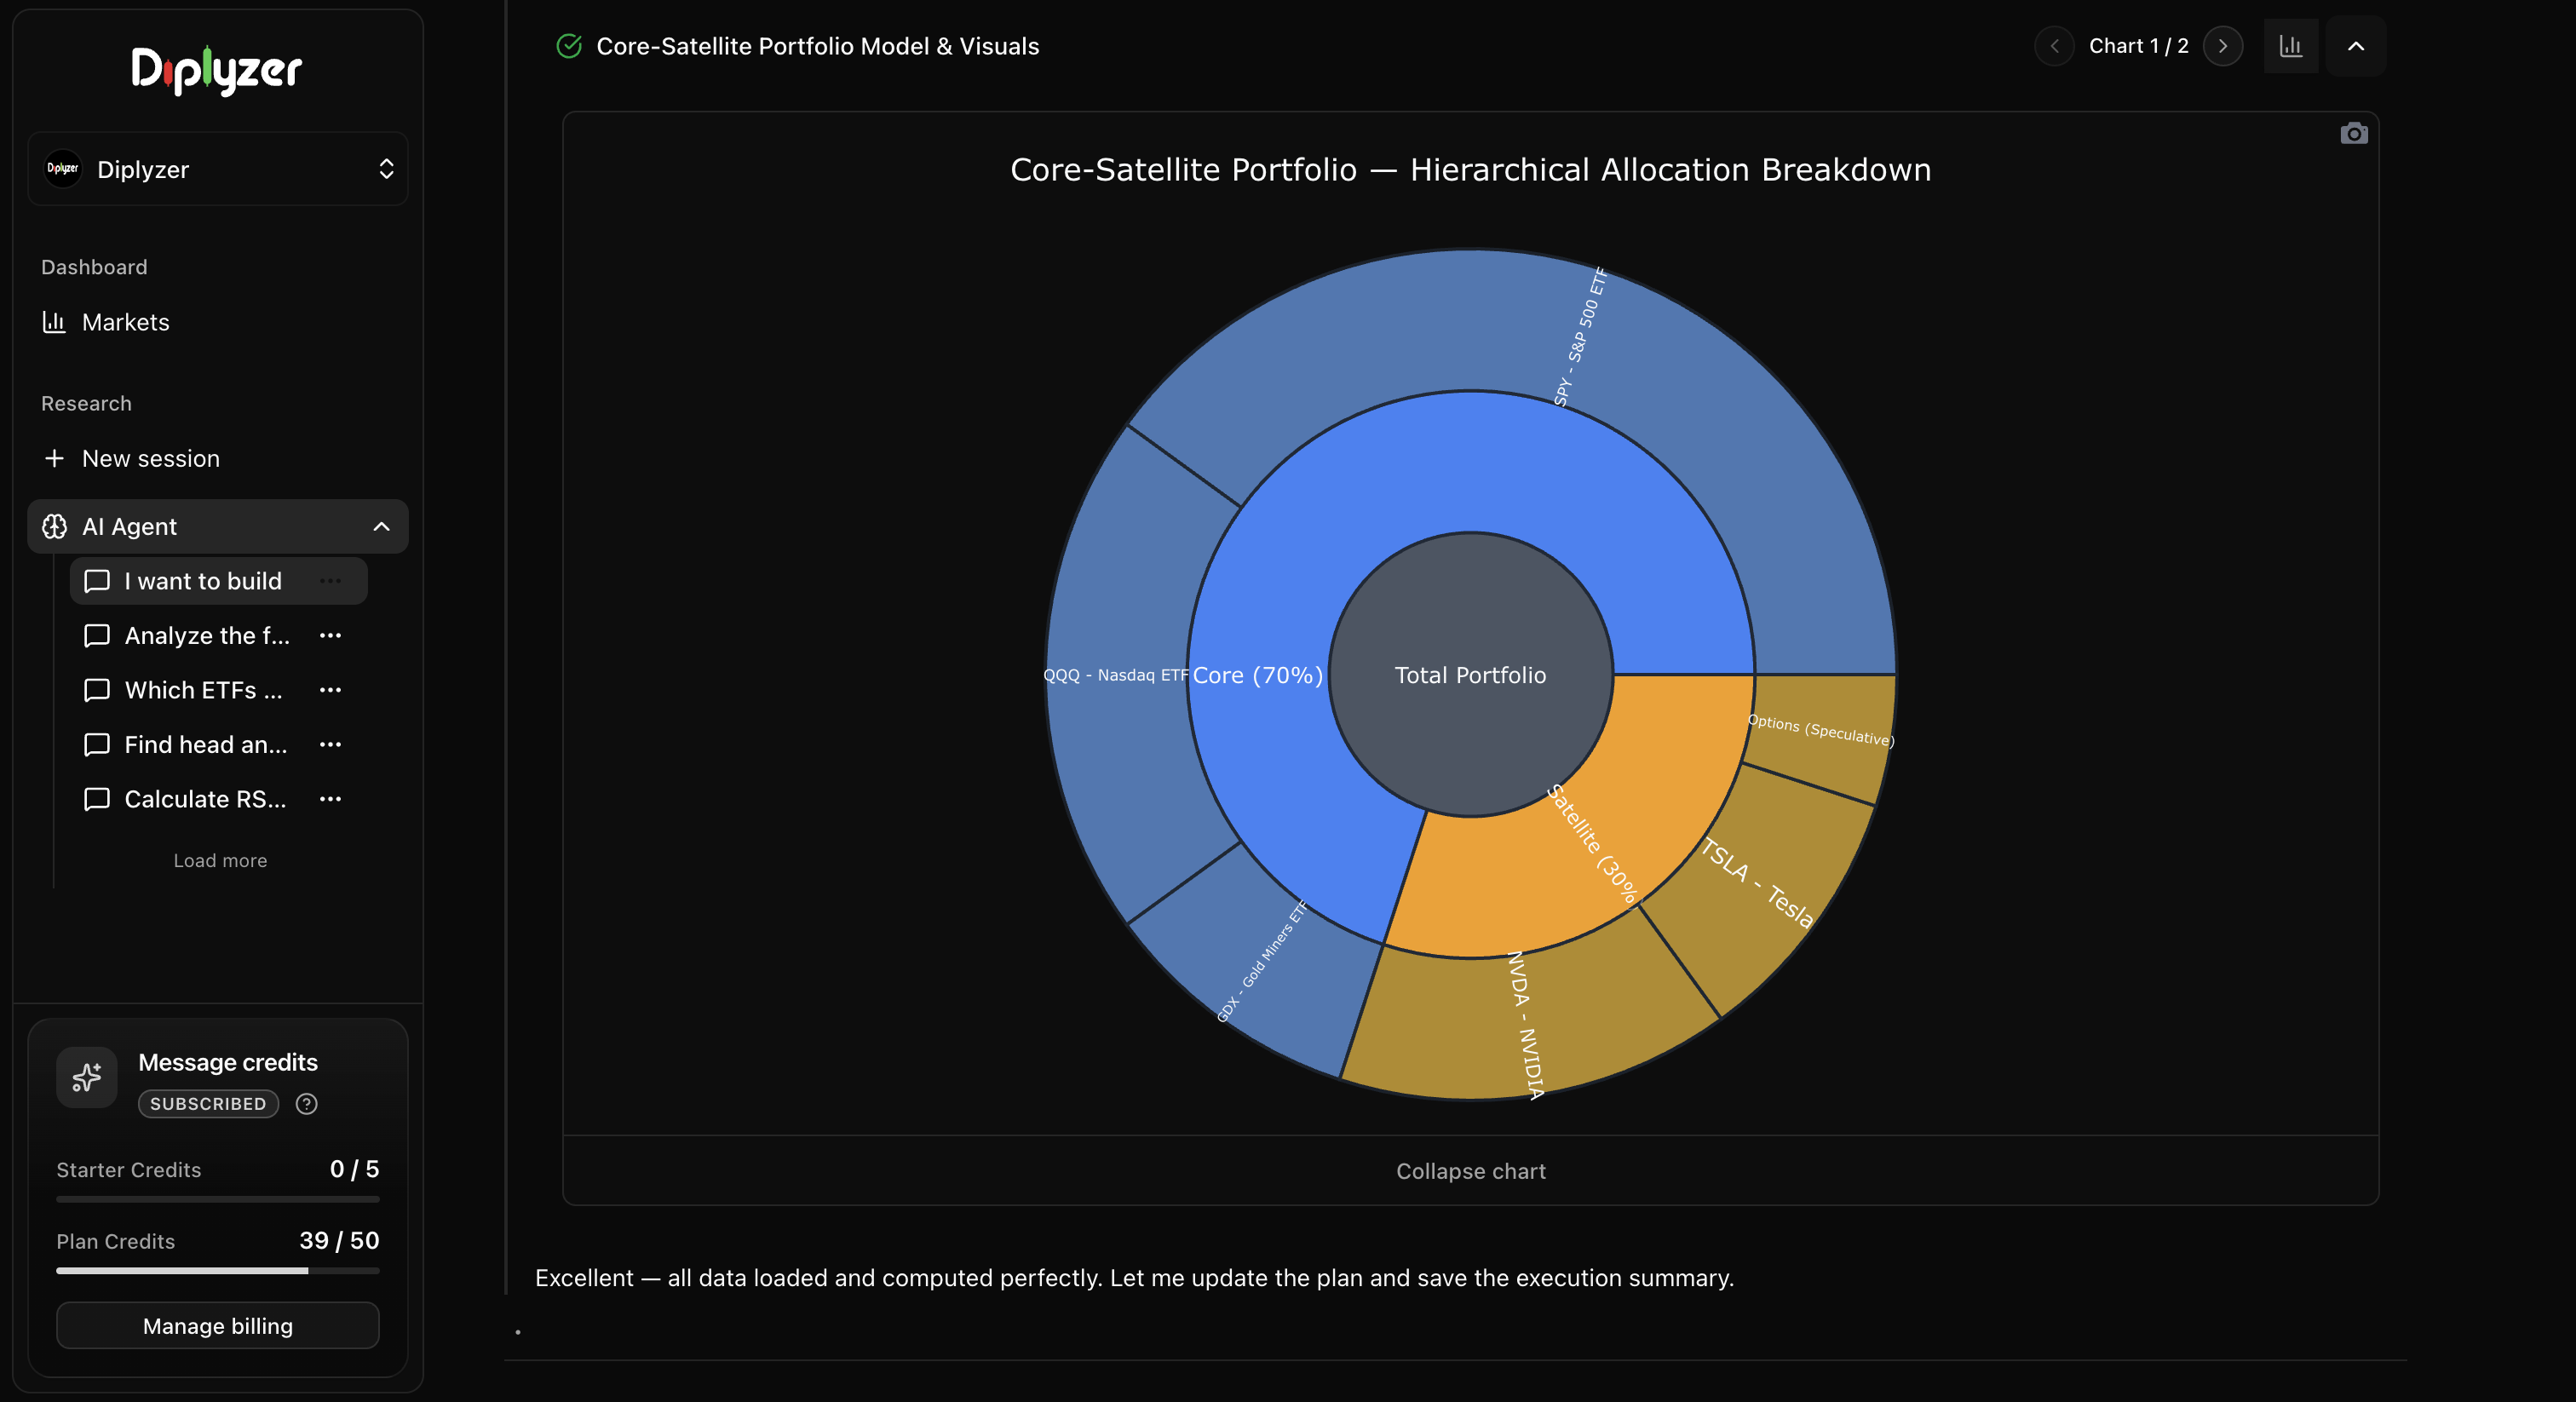
The Core-Satellite Framework
One of the most practical portfolio construction approaches for active traders:
Core (60–80% of portfolio): Stable, diversified holdings that provide exposure to your primary market thesis. Typically index ETFs, sector ETFs, or high-conviction long-term positions. Lower turnover, more stable.
Satellite (20–40% of portfolio): Higher-conviction, higher-concentration trades around specific catalysts, technical setups, or thematic opportunities. Higher turnover, more active management.
This structure provides stability in the core while allowing active research in the satellite.
AI Prompt
"Explain the theoretical mechanics of the core-satellite allocation model: compare the historical volatility, maximum drawdown, and tracking error of a 70/30 core-satellite structure against a broad market benchmark (S&P 500) over a 10-year period."
Step 3: Position Sizing Rules
How much capital to allocate to each position is one of the most consequential decisions in portfolio risk management. Quantitative portfolio managers use explicit mathematical rules.
Equal Weighting
The simplest approach: divide capital equally across all positions. A 10-position portfolio would have 10% in each.
Pros: Simple, enforces diversification, eliminates single-asset bias Cons: Treats higher-volatility assets with the same dollar risk as lower-volatility assets
Conviction-Weighted Sizing
Positions are sized according to explicit factor alignment tiers:
| Tier | Allocation Range | Description |
|---|
| Core allocation | 5–10% | Comprehensive fundamental + multi-timeframe factor alignment |
| Standard allocation | 3–5% | Solid fundamental thesis with moderate volatility |
| Tactical/exploratory | 1–2% | Thematic or early-stage research positions |
Maximum single position constraint: Quantitative risk managers often cap single-name equity exposure at 10% to prevent idiosyncratic risk from dominating overall portfolio variance.
Risk-Weighted Sizing (Volatility Parity)
Size positions so that each contributes approximately equal risk (not equal capital) to the portfolio. Higher-volatility positions get smaller capital allocations; lower-volatility positions get larger allocations.
The calculation: Position size = (Target Dollar Risk) / (Asset Price × Risk Distance)
This quantitative approach standardizes portfolio drawdown exposure across instruments with varying volatilities.
AI Prompt
"Demonstrate the mathematical formula for fixed fractional position sizing: calculate share sizing for hypothetical stocks with ATRs of $2.00, $5.00, and $10.00 given a defined 1% risk constraint on a $75,000 model portfolio."
Step 4: How Many Positions to Hold
The optimal number of positions is one of the most studied questions in portfolio theory. Academic literature and empirical evidence illustrate the trade-offs:
The Case for Concentration (Fewer Positions)
- Each additional position beyond 15–20 provides diminishing marginal diversification benefits
- Concentration allows focused tracking of deep fundamental quality
- Easier to continuously audit financial filings and earnings transcripts across 10–15 positions
The Case for Diversification (More Positions)
- Substantially reduces idiosyncratic (single-company) operational and regulatory risk
- Broadens exposure across multiple macroeconomic themes
- Lowers aggregate portfolio return volatility
Analytical Ranges by Strategy
| Portfolio Strategy | Typical Position Count |
|---|
| Intraday / momentum research | 2–5 active symbols |
| Swing / tactical factor research | 5–15 positions |
| Fundamental growth research | 10–25 positions |
| Multi-asset diversified portfolio | 20–40 holdings |
| Factor ETF asset allocation | 3–10 broad-market ETFs |
Step 5: Sector and Factor Constraints
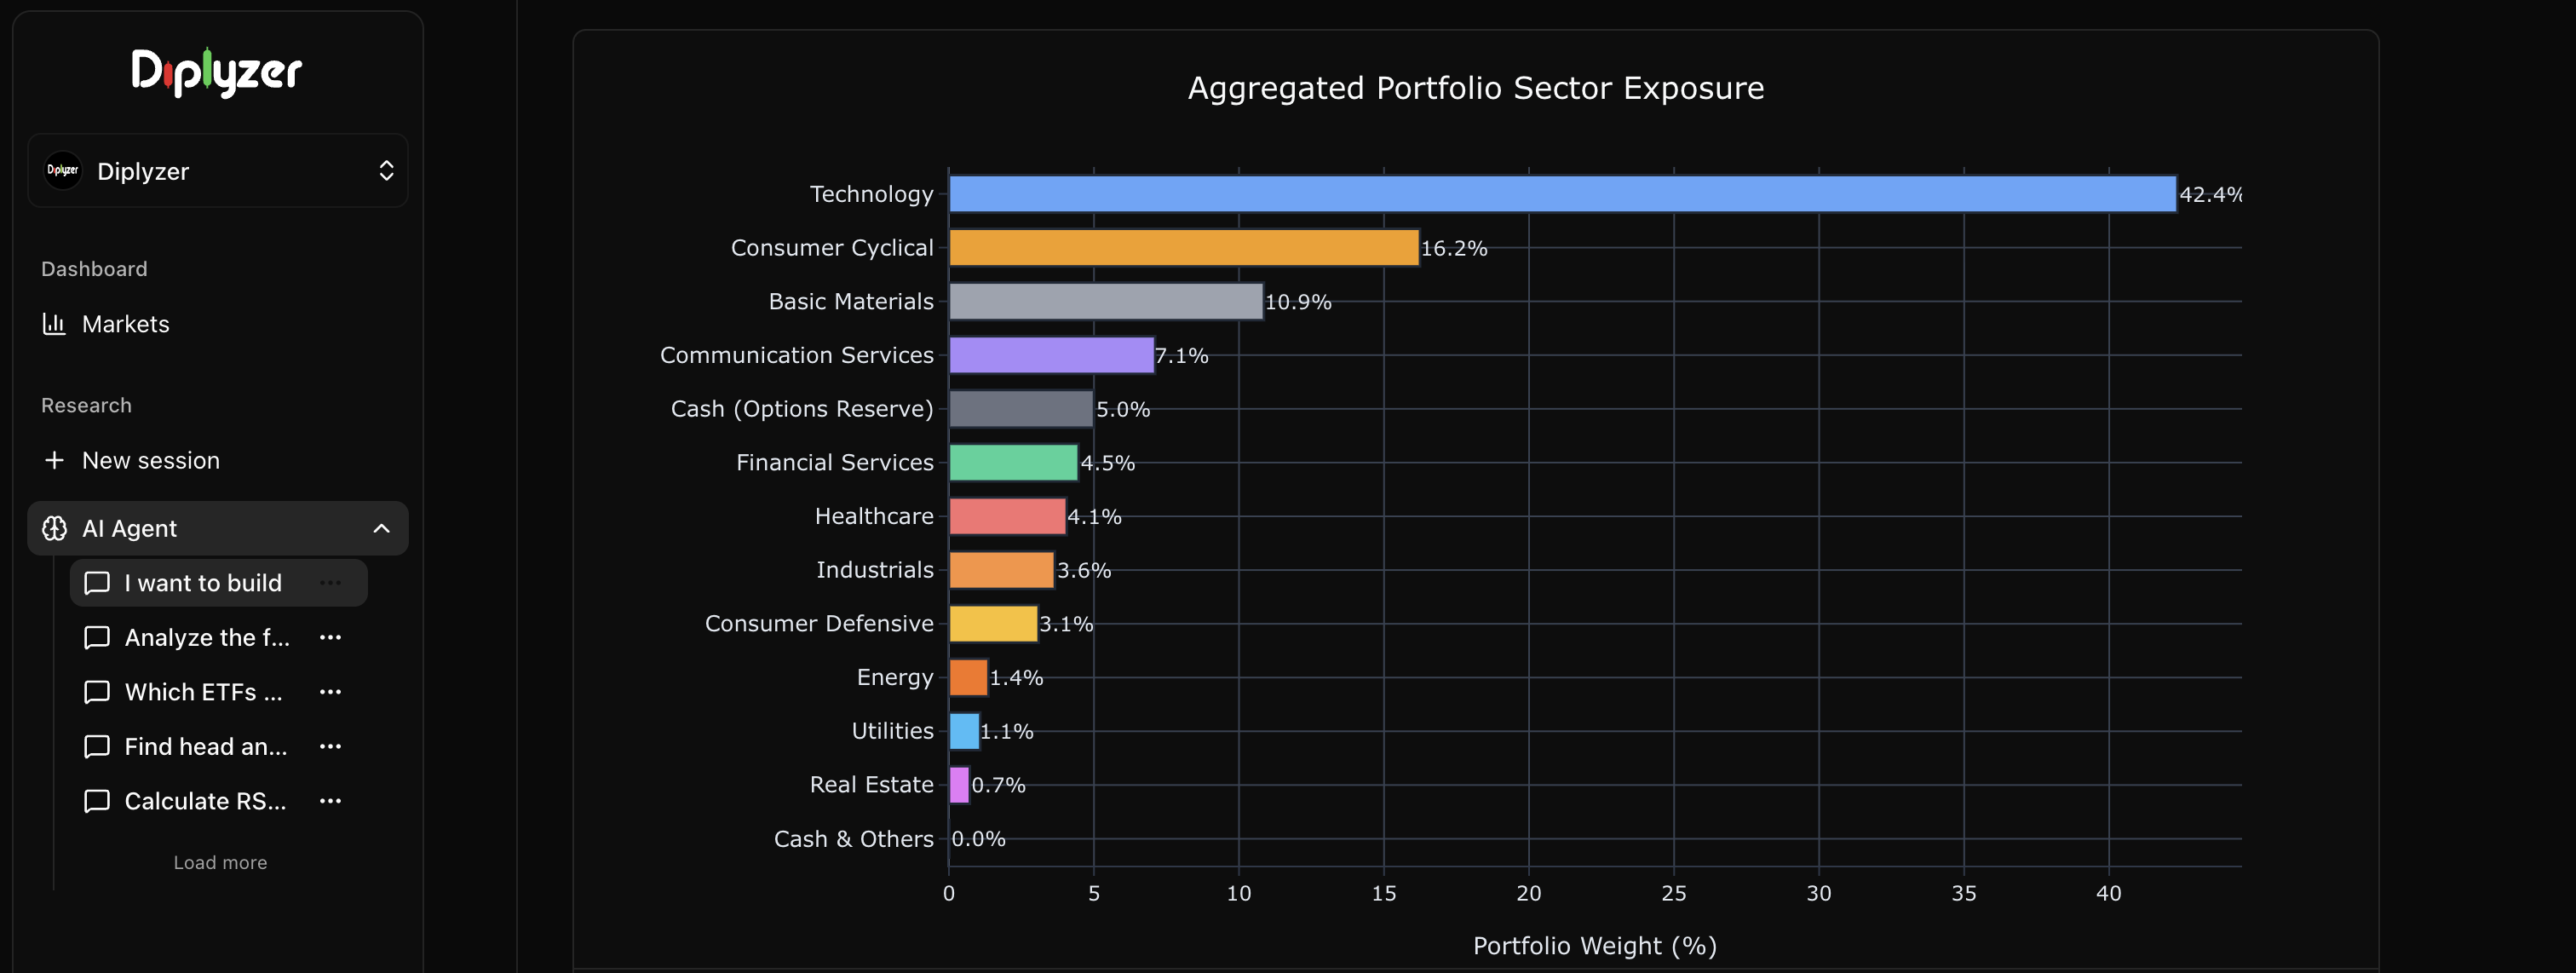
Without explicit mathematical constraints, portfolios naturally accumulate unintended factor concentrations based on trailing momentum.
Sector constraints: Quantitative frameworks typically cap single sector weights at 25–30% of aggregate portfolio value to limit exposure to single-sector macro shocks.
Factor constraints: Continually audit your portfolio's underlying factor sensitivities:
- Market beta: How much of aggregate portfolio variance is explained by broader market index moves?
- Market capitalization: What percentage is concentrated in small-cap, mid-cap, or mega-cap equities?
- Value vs. Growth: Are holdings tilted heavily toward a specific factor regime?
- Financial Quality: Are constituent holdings maintaining high Piotroski F-Scores and Altman Z-Scores?
AI Prompt
"Review my current portfolio holdings [list]. What are my dominant sector exposures, and do any sectors exceed 25% of the portfolio? What factor biases does my portfolio have — am I tilted toward growth, value, momentum, or quality? Where are my biggest concentration risks?"
Translating a Watchlist into a Coordinated Portfolio
Moving from an unstructured watchlist to a mathematically balanced portfolio requires systematic factor evaluation.
The four-pillar evaluation framework:
- Technical alignment: Is the asset in an established multi-timeframe trend or base formation?
- Fundamental quality: Does the balance sheet exhibit strong free cash flow yield and low leverage?
- Correlation profile: Does adding this asset increase concentration, or provide true diversification?
- Factor contribution: How does this asset shift overall portfolio beta and sector weights?
AI Prompt
"Analyze the factor characteristics of this watchlist [list of stocks]: calculate each asset's 12-month correlation matrix against my current portfolio [list], and summarize each company's Piotroski F-Score and sector exposure."