Most investors measure their portfolio performance by a single number: percentage return. "I was up 18% last year" sounds like success — but 18% in a year when the S&P 500 was up 26% is actually significant underperformance. And 18% in a year when the market was down 10% is exceptional alpha generation.
Performance attribution is the discipline of understanding why your portfolio returned what it did — separating the components of return, identifying where value was added and destroyed, and building an honest assessment of whether you are generating genuine investment skill or just riding market beta.
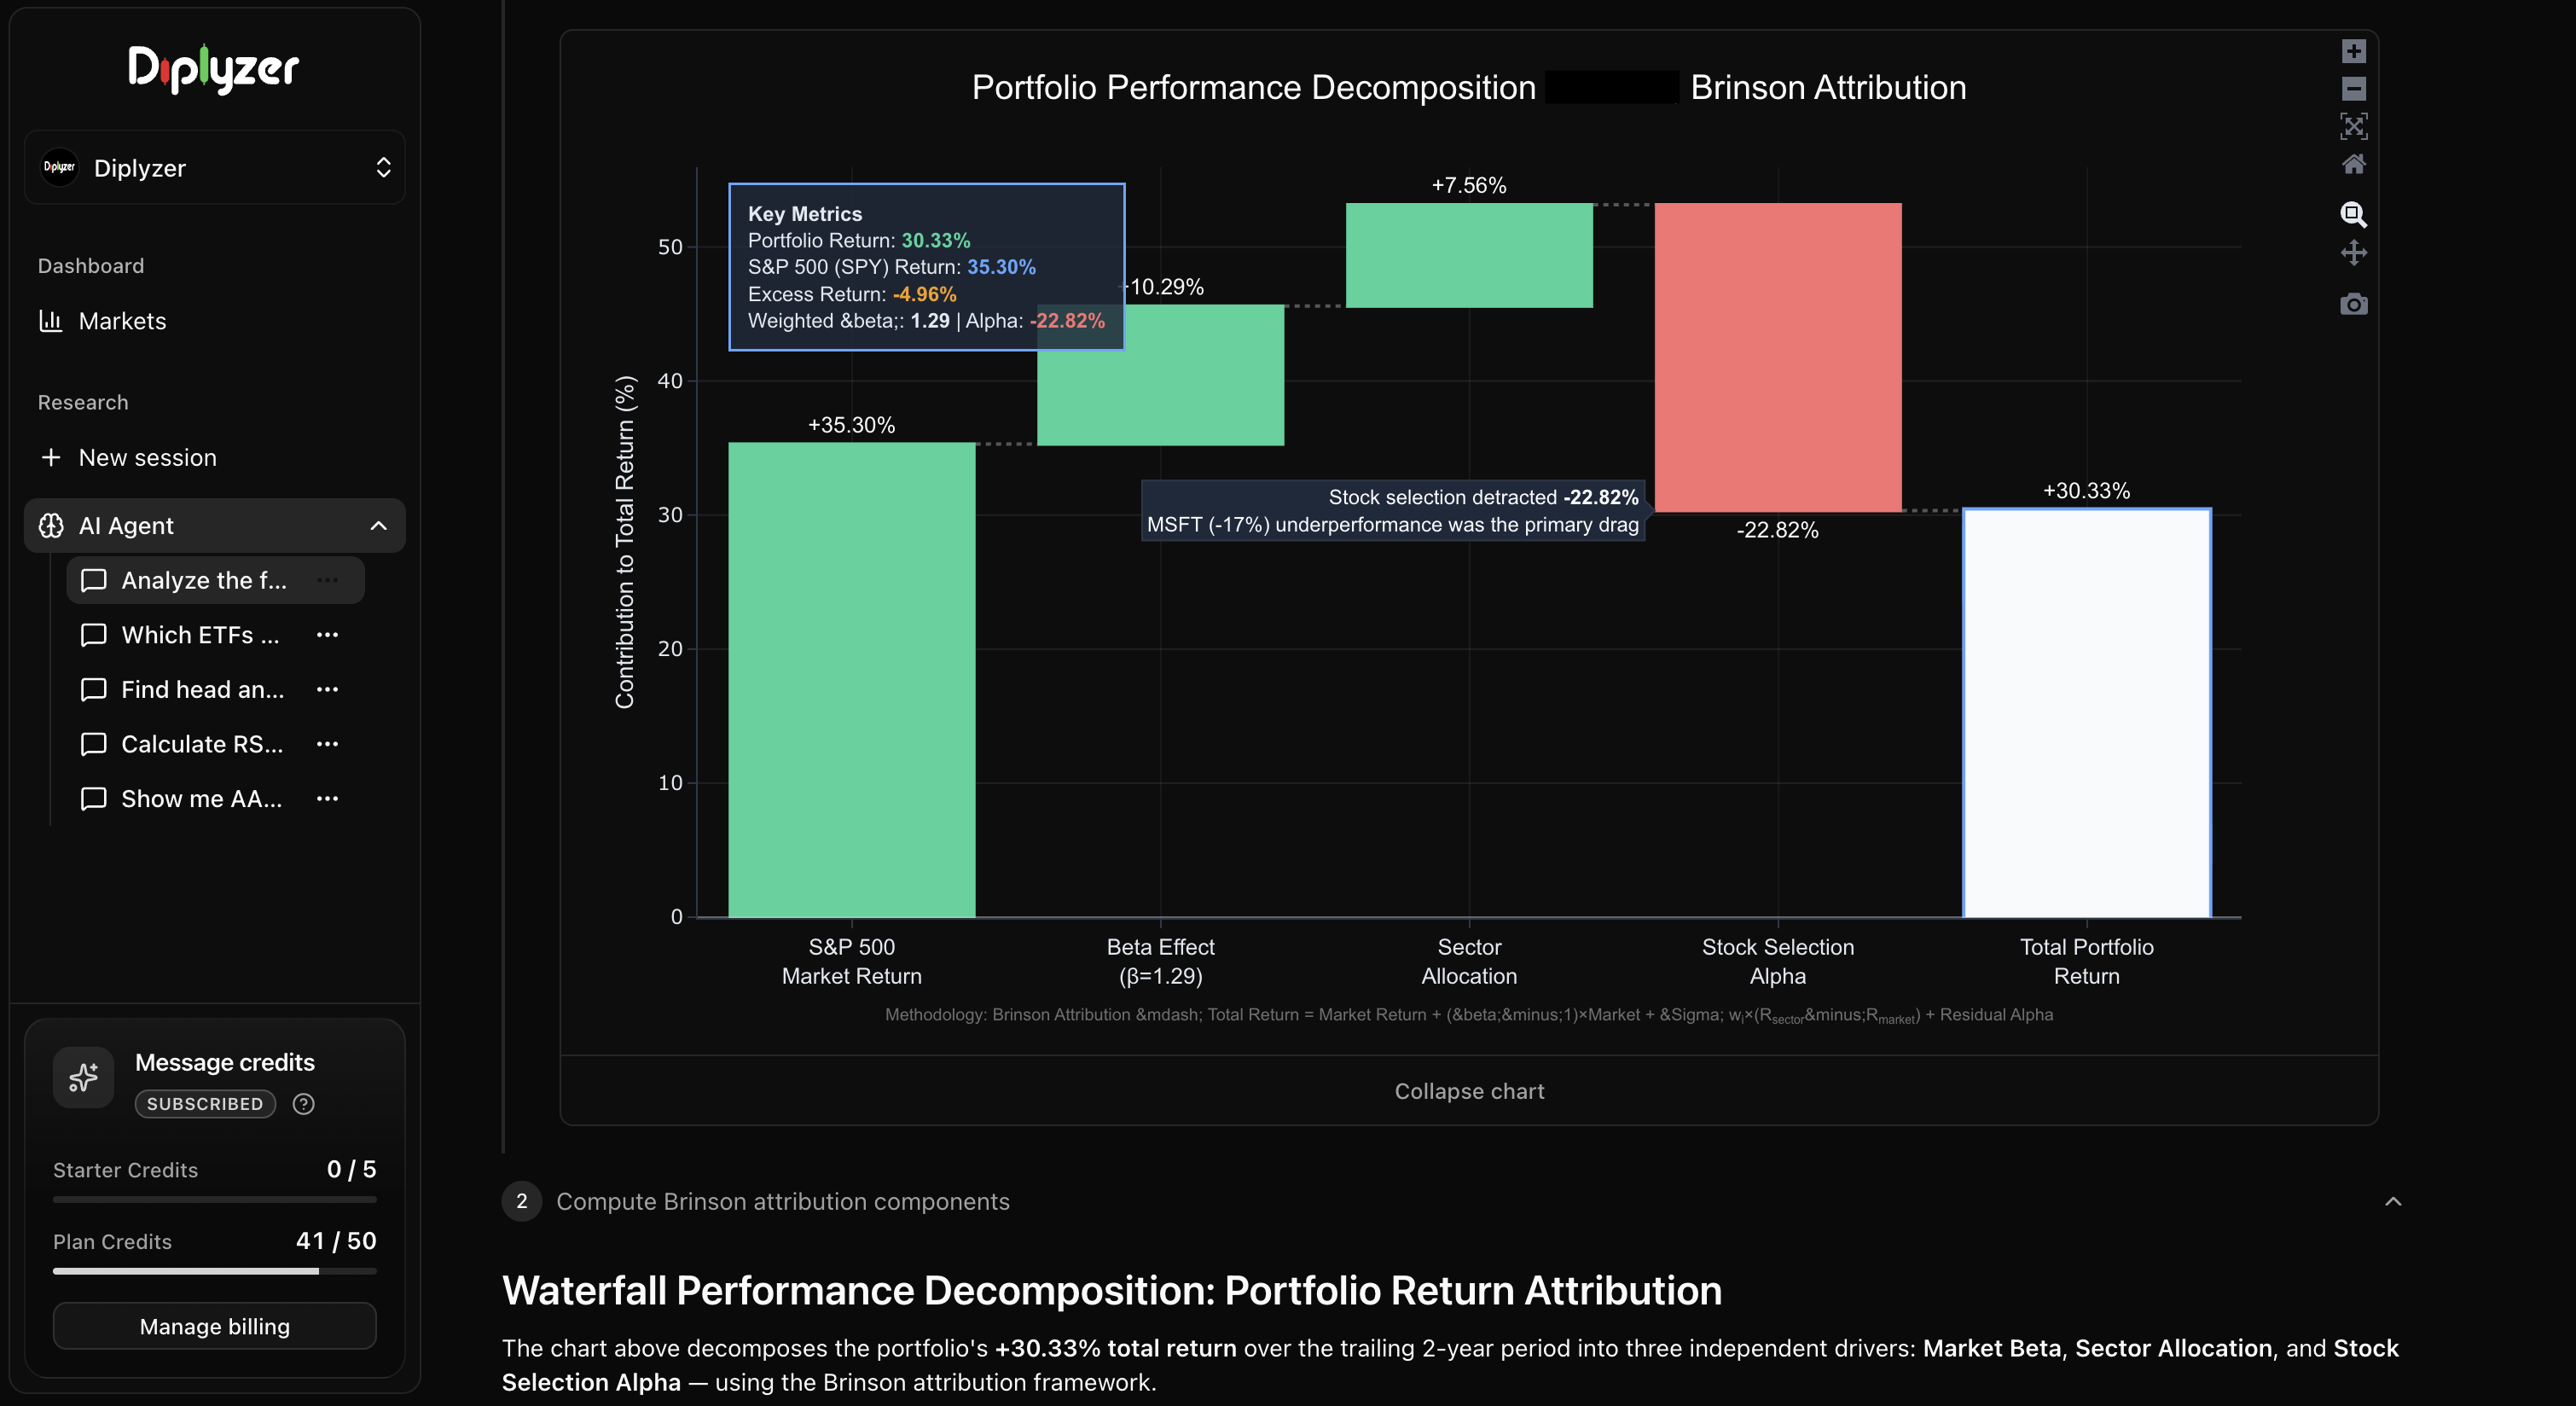
The Anatomy of Portfolio Returns
Every portfolio return can be decomposed into distinct sources:
1. Market Return (Beta)
The portion of your return attributable simply to market exposure. If you own stocks that move with the market, you capture the market's return in proportion to your beta exposure. This is not skill — it is market exposure you could obtain from an index fund at near-zero cost.
2. Factor Returns
Returns attributable to systematic factor exposures — value, growth, size, momentum, quality — that differ from the broad market. A portfolio concentrated in high-momentum growth stocks in a momentum bull market will outperform the index — but that outperformance may be 100% explained by the momentum factor, not individual stock selection skill.
3. Alpha
The residual return after accounting for all market and factor exposures. True alpha is return generated by skill — stock selection, timing, risk management — that cannot be explained by passive exposure to known risk factors.
Why this matters: If your portfolio returned 25% while the market returned 20% and the momentum factor added 8% — you actually underperformed on a risk-adjusted, factor-adjusted basis. Understanding this prevents misattributing luck to skill.
Benchmarking Correctly
The choice of benchmark is one of the most consequential (and most manipulated) decisions in performance measurement.
The Wrong Way to Benchmark
Benchmark cherry-picking: Choosing the index that makes your performance look best. A small-cap value manager who compares their returns to the S&P 500 (large-cap growth in recent years) may look like a star simply because they had different factor exposure.
Using no benchmark at all: "I made 15%" tells you nothing without a reference point. What did the market do? What would a passive allocation have returned?
Ignoring risk: A portfolio that returned 20% while taking on twice the market's volatility is not outperforming — it is taking more risk for market-equivalent returns.
The Right Benchmark for Each Strategy
| Portfolio Style | Appropriate Benchmark |
|---|
| US large-cap stocks | S&P 500 (SPY) |
| US growth stocks | Nasdaq 100 (QQQ) |
| Small-cap stocks | Russell 2000 (IWM) |
| International equities | MSCI EAFE (EFA) |
| Diversified multi-asset | Blended benchmark (e.g., 60% SPY / 40% AGG) |
| Tactical trading | Treasury bill rate (your hurdle rate) |
AI Prompt
"Calculate my portfolio's return versus the appropriate benchmark over the last quarter, 6 months, and 1 year. My portfolio consists of [list]. Am I outperforming or underperforming my benchmark on an absolute and risk-adjusted basis?"
Raw returns without risk context are meaningless. These metrics provide a complete picture:
Sharpe Ratio
Formula: (Portfolio Return − Risk-Free Rate) / Portfolio Standard Deviation
The Sharpe ratio measures return per unit of total risk. A Sharpe ratio above 1.0 is generally considered good; above 2.0 is exceptional.
Limitation: Standard deviation penalizes upside volatility the same as downside. A portfolio that surges 30% in a single month gets penalized even though that's desirable.
Sortino Ratio
Like the Sharpe ratio, but only penalizes downside volatility (negative returns). More appropriate for portfolios where upside volatility is welcome.
Formula: (Portfolio Return − Target Return) / Downside Deviation
A Sortino ratio above 1.5 is generally strong.
Maximum Drawdown
The largest peak-to-trough decline during the measurement period. Maximum drawdown captures the worst-case experienced loss — which matters enormously for real-world portfolio management, since large drawdowns trigger emotional selling and compound recovery problems.
A portfolio with 20% returns and 30% max drawdown is not better than a portfolio with 15% returns and 10% max drawdown — the latter may actually be superior risk-adjusted.
Calmar Ratio
Formula: Annualized Return / Maximum Drawdown
Measures return relative to the maximum drawdown experienced. A Calmar ratio above 1.0 is good; above 2.0 is excellent.
AI Prompt
"Calculate the Sharpe ratio, Sortino ratio, and maximum drawdown for my portfolio over the last 12 months. Compare these risk-adjusted metrics to the SPY benchmark. On a risk-adjusted basis, am I adding value or simply taking on more risk for comparable returns?"
Attribution Analysis: Dissecting Your Decisions
Attribution analysis breaks your total return into the contribution from individual decisions, allowing you to identify what's actually working.
Sector Attribution
Sector allocation effect: Did overweighting or underweighting certain sectors relative to your benchmark add or subtract value?
Stock selection effect within sectors: Among the sectors you were in, did your specific stock picks outperform the sector average?
Interaction effect: The combined benefit of being in the right sector AND picking the right stocks within it.
AI Prompt
"Break down my portfolio's return attribution by sector. For each sector I'm invested in, show me: (1) how much the sector itself contributed to my return, (2) how my specific stock picks performed relative to the sector average, and (3) which sector bets were my biggest wins and losses."
Position-Level Attribution
Best and worst contributors: Which specific positions added the most to and subtracted the most from your return? This is important data — but distinguish between positions that made money because of good decisions versus those that benefited from luck.
Sizing analysis: Did you size your best ideas proportionally? A stock that rose 40% but was only 1% of your portfolio contributed 0.4% to your return. The same stock at 5% would have contributed 2.0%. Position sizing discipline — or the lack of it — is often revealed here.
Win rate and average gain/loss: What percentage of your positions made money? What was the average gain on winners versus the average loss on losers? Even a 40% win rate can be profitable if your average win is 3× your average loss.
AI Prompt
"Analyze my trade history for the last 6 months. What was my win rate, average gain on winners, average loss on losers, and resulting expectancy per trade? Which individual positions were my biggest contributors and biggest detractors? Were my best performers my largest positions or were they undersized?"
Separating Skill from Luck
One of the most intellectually honest — and most difficult — challenges in performance evaluation is separating skill from luck.
The Sample Size Problem
Even a skilled investor will have losing months, quarters, and occasionally losing years. And an unskilled investor will have stretches of good luck. With small sample sizes, it is impossible to determine which is which with statistical confidence.
The uncomfortable truth: You need 3–5 years of returns to begin making statistically meaningful judgments about investment skill. Most investors make decisions about whether they "have an edge" based on far too few trades or too short a period.
Process vs. Outcome
The most reliable way to evaluate skill is to judge the quality of the decision-making process, not just the outcome:
- Good process, good outcome: Evidence of skill
- Bad process, bad outcome: Evidence of poor skill
- Good process, bad outcome: Unlucky — but skill is likely present
- Bad process, good outcome: Lucky — but skill is not present
A trade where you correctly identified an opportunity, sized it appropriately, and managed your risk — but the stock randomly dropped due to an idiosyncratic event — was a well-executed trade. Don't penalize your process for bad luck.
AI Prompt
"Review the last 15 trades I've made [describe trades]. For each, evaluate whether the decision-making process was sound — regardless of the outcome. Where am I making systematic errors in my process, and where am I being penalized by bad luck despite a good process?"
| Frequency | What to Review |
|---|
| Daily | Unrealized P&L, positions near stops, upcoming catalysts |
| Weekly | Weekly return vs. benchmark, position changes, thesis checks |
| Monthly | Monthly return attribution by sector and position, metrics vs. benchmark |
| Quarterly | Full attribution analysis, factor exposure review, strategy assessment |
| Annually | Complete Sharpe/Sortino/drawdown analysis, honest skill vs. luck evaluation |