Chart patterns are among the most established tools in technical analysis. They are repeating price formations that reflect the psychology of market participants — supply, demand, indecision, and institutional accumulation — observed across liquid markets for over a century.
Unlike lagging indicators derived purely from moving averages, chart patterns emerge directly from geometric price action itself. Learning to read them is learning to read market structure.
Why Chart Patterns Work
Chart patterns work because markets are driven by market participant behavior, and collective behavior is structural. When a stock consolidates after a strong uptrend, market participants weigh whether the consolidation represents a pause before continuation or the beginning of a reversal. The pattern that forms during this consolidation reflects how that balance of supply and demand resolves.
The same structural dynamics play out across asset classes and timeframes. That's why a cup and handle in Apple's weekly chart and a cup and handle in Bitcoin's daily chart follow the same structural logic.
Key principle: Chart patterns do not predict future prices with certainty — they identify geometric formations where the historical statistical probability of a directional expansion is elevated.
Continuation Patterns
Continuation patterns form during pauses in an established trend and suggest the prior trend is statistically more likely to resume once the consolidation completes.
Bull Flag
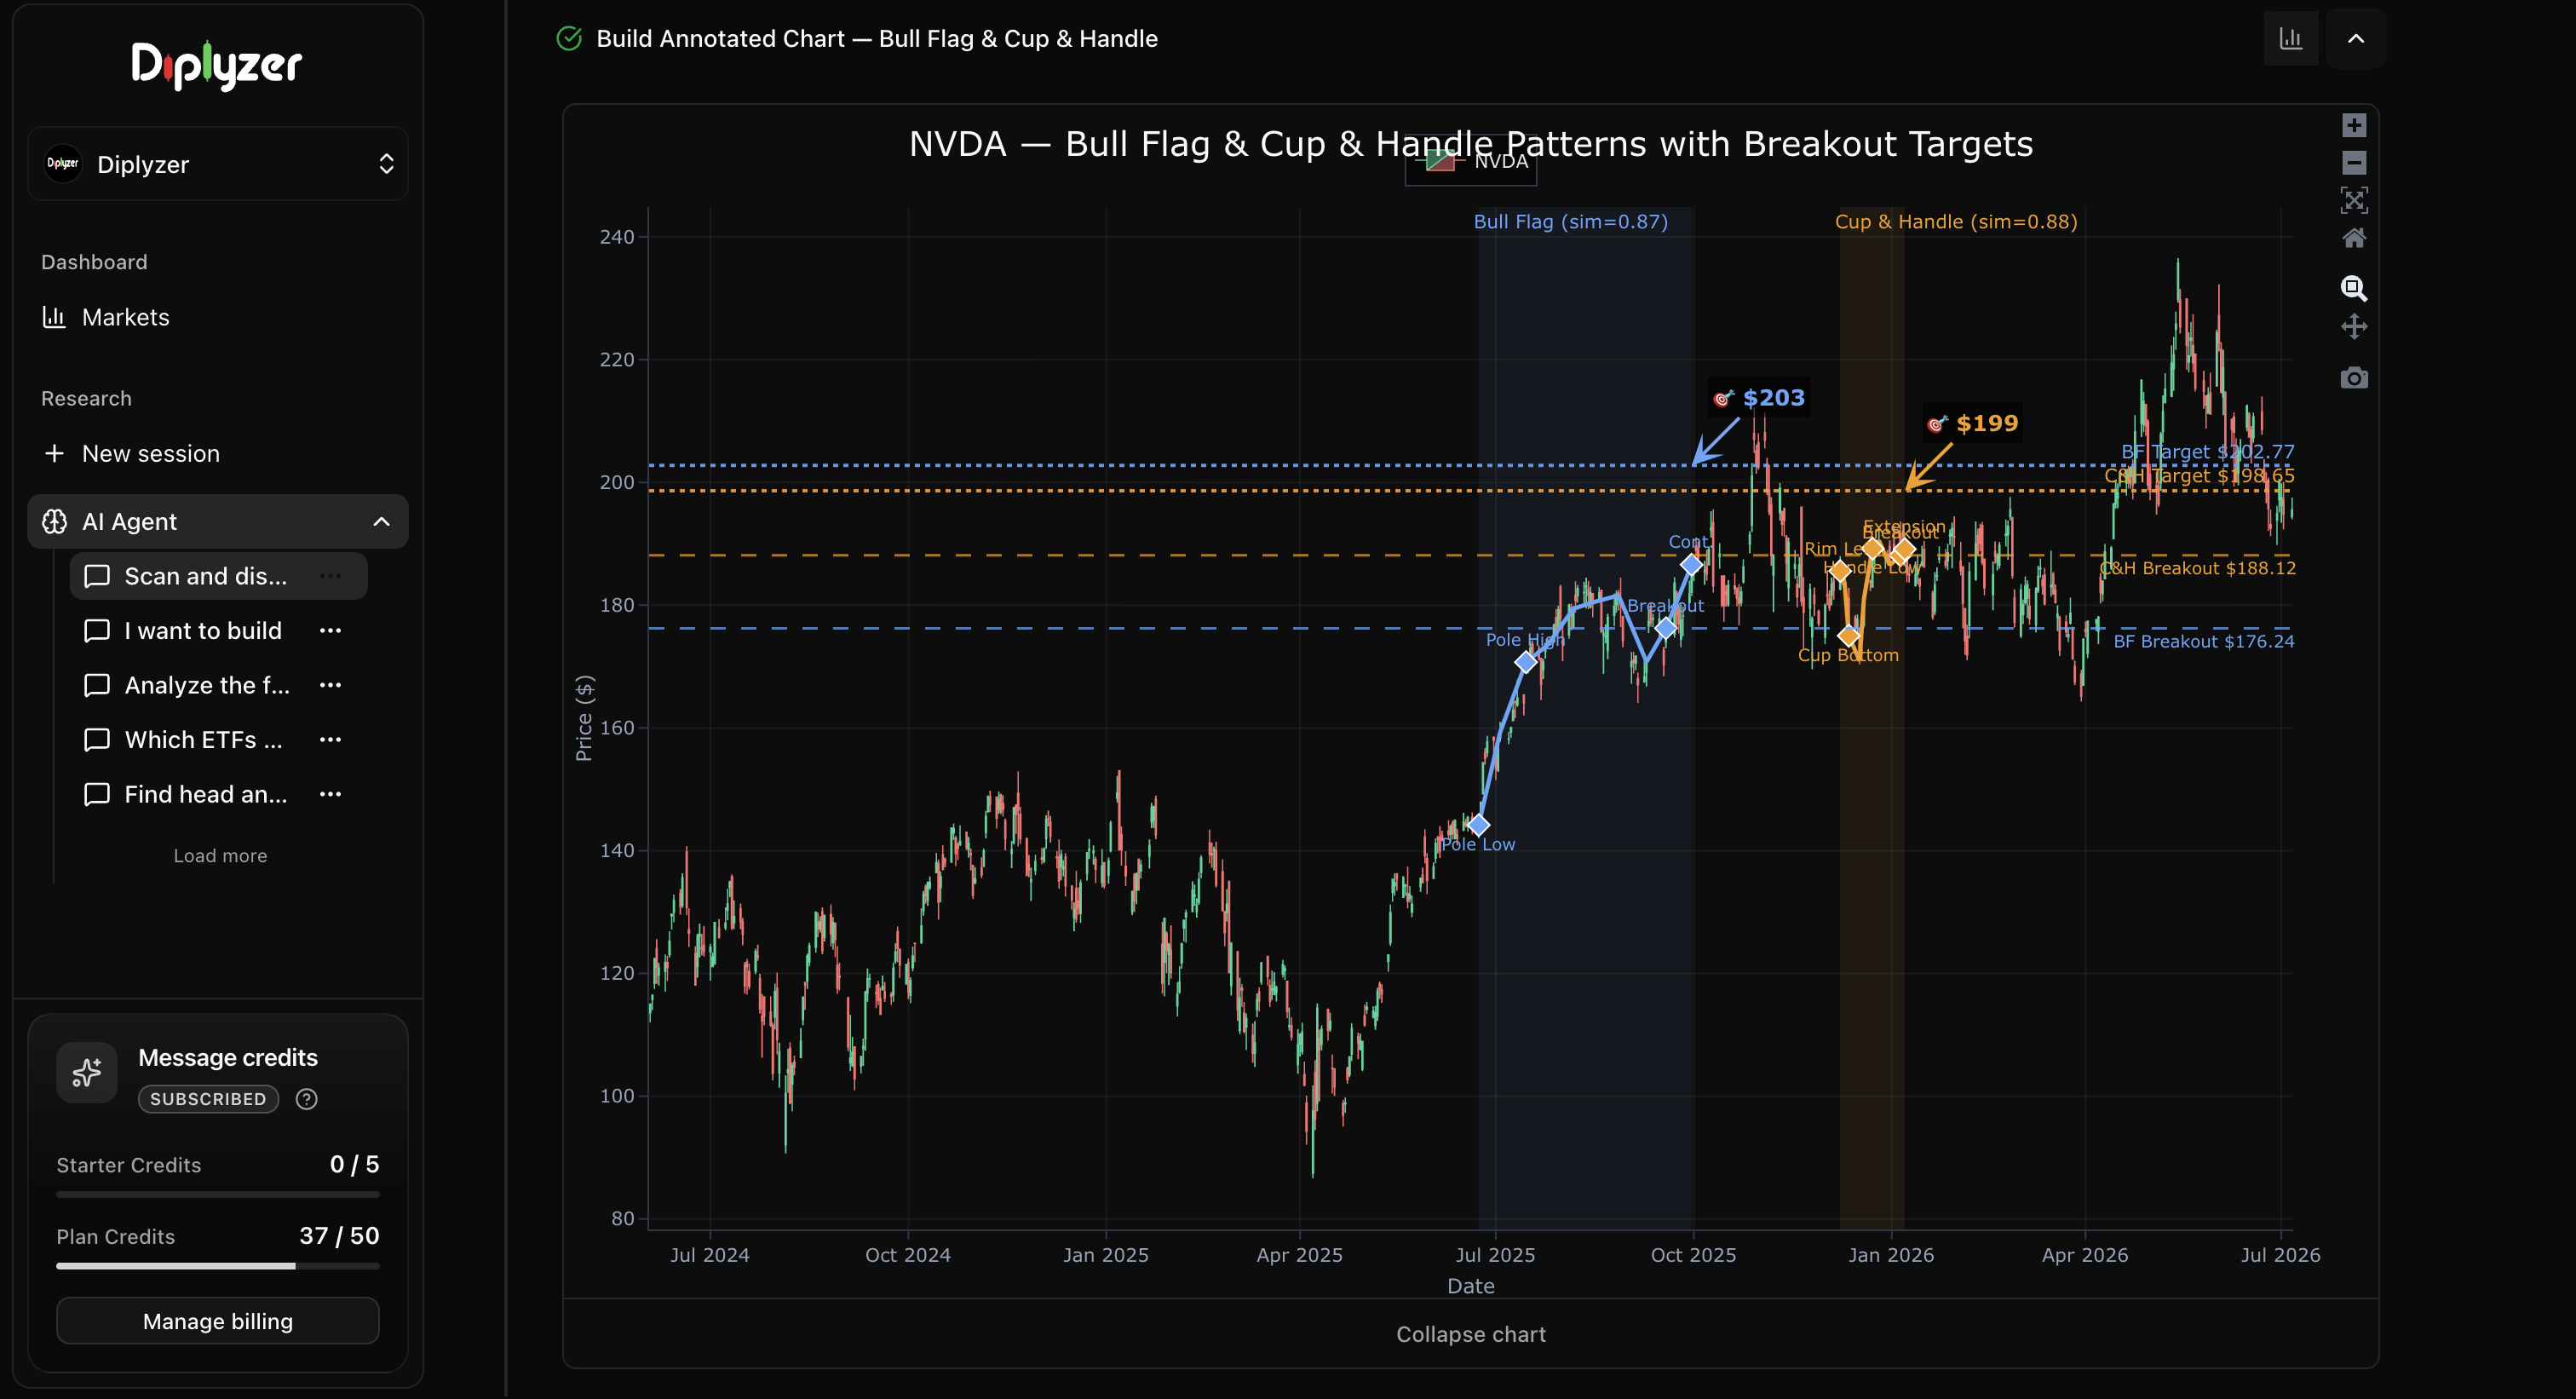
The bull flag is a classic continuation pattern. It forms when a sharp impulsive upward move (the flagpole) is followed by a tight, sideways-to-slightly-downward consolidation (the flag).
Anatomy of a bull flag:
- Flagpole: A strong, high-volume impulsive move upward — often 20–50% in 1–3 weeks
- Flag: A controlled pullback of 30–50% of the flagpole move, on declining volume
- Breakout: A break above the flag's upper boundary on expanding volume
What to look for:
- The flag should be tight — wide, choppy flags are lower quality
- Volume should decline noticeably during the flag formation
- Breakout volume should exceed the 20-day average significantly
Ask Diplyzer:
AI Prompt
"Scan S&P 500 stocks with positive free cash flow ($10B+ market cap) for bull flag patterns completing on the daily chart. Show me the flagpole height, current flag depth, and average volume during the consolidation."
Bear Flag
The bear flag is the inverse — a sharp downward impulse followed by a slight upward consolidation on declining volume, preceding potential further downside.
Bear flag mechanics:
- Breakdown occurs on a decisive close below the lower flag boundary
- Volume should surge on the breakdown
- Measured move projection: the flagpole distance projected downward from the breakdown point
Cup and Handle
The cup and handle is one of the most celebrated patterns in technical analysis, popularized by William O'Neil. It represents a multi-month base formation before a major breakout.
Structure:
- Cup: A rounded bottom, resembling the shape of a U (not a V), typically spanning 6 weeks to 6 months
- Handle: A tight, low-volume pullback of 8–12% on the right side of the cup, forming over 1–4 weeks
- Breakout: A decisive close above the handle's upper pivot point on 2–3× average volume
Quality markers:
- Cup depth should be 15–35% below the left peak
- The handle should form in the upper half of the cup
- Strong fundamental backing with positive earnings revisions
- RS line should be near highs on breakout day
Ask Diplyzer:
AI Prompt
"Find Nasdaq 100 Tech stocks ($10B+ market cap) with positive 3-year revenue growth that have formed a cup and handle base on the weekly chart. Show me the cup depth, handle consolidation range, and the breakout resistance pivot level."
Ascending Triangle
An ascending triangle features a flat resistance level at the top and a rising support trendline at the bottom. Each successive low is higher, indicating demand is absorbing supply at higher levels.
Interpretation: Buyers are willing to support price higher each time the stock pulls back, while sellers remain at a fixed level. Eventually, buying volume overwhelms resistance and price breaks upward.
Ask Diplyzer:
AI Prompt
"Is [stock] forming an ascending triangle? Show me the horizontal resistance level, the rising higher lows trendline, and the pattern measured move projection."
Reversal Patterns
Reversal patterns form after sustained trends and indicate a potential change in structural direction.
Head and Shoulders
The head and shoulders is a widely recognized reversal pattern in classical technical analysis.
Structure (topping pattern):
- Left shoulder: A rally to a local high, followed by a pullback
- Head: A higher rally to the pattern's peak, then a deeper pullback
- Right shoulder: A lower rally that fails to reach the head's level
- Neckline: A trendline connecting the two pullback lows between the shoulders
Breakdown mechanics:
- A breakdown is confirmed when price closes below the neckline on expanding volume
- Measured move projection: The distance from the head to the neckline, projected downward from the breakdown level
Inverse head and shoulders: The same pattern inverted — a bullish reversal formation at the base of a downtrend.
Ask Diplyzer:
AI Prompt
"Does [stock] show a head and shoulders pattern on the daily chart? Identify the left shoulder, head, and right shoulder, measure the neckline, and calculate the textbook measured move projection on a breakdown."
Double Top
A double top forms when price tests the same resistance level twice — failing both times — creating an M-shaped distribution pattern.
Validation requirements:
- Both peaks should be at approximately the same price level (within 2–3%)
- There should be a clear trough between the two peaks
- The pattern is confirmed on a close below the trough level
- Volume typically declines on the second peak versus the first
Target measurement: The distance from the trough to the peaks, projected downward from the neckline breakdown.
Double Bottom
The mirror of the double top — a bullish reversal where price tests the same support level twice and bounces. Confirmed on a close above the middle peak.
Symmetrical Patterns
Symmetrical Triangle
A symmetrical triangle forms when price makes lower highs and higher lows, compressing into a tighter range. Neither buyers nor sellers dominate — until the triangle resolves.
- Bullish resolution: A break above the upper trendline (continuation of prior uptrend)
- Bearish resolution: A break below the lower trendline (continuation of prior downtrend)
The direction of resolution depends heavily on context — the prior trend, the broader market environment, and whether volume increases on the breakout.
Pennant
A pennant is a short-term symmetrical triangle that forms immediately after a sharp move. It's functionally identical to a flag but with a triangular rather than rectangular shape.
How to Validate Any Chart Pattern
Not all patterns are equal. Apply these analytical filters when evaluating any chart formation:
| Validation Criterion | What to Check |
|---|
| Volume profile | Volume should decline during consolidation, expand on breakout |
| Pattern geometry | Symmetry, proper depth, handle consolidation range (for C&H) |
| Market context | Is the broader market in an uptrend or downtrend? |
| Relative strength | Is the stock outperforming its sector and the SPX? |
| Fundamental backdrop | Are earnings growth and balance sheet metrics supportive? |
| Time horizon | Weekly patterns > Daily > Intraday in structural significance |
A pattern in an unfavorable macro regime has a higher false breakout rate. The strongest confluence occurs when the geometric pattern, market trend, sector, and fundamentals align.
Common Pattern Analysis Pitfalls
Analyzing every minor formation: Focus on high-confidence, textbook-quality geometric structures.
Ignoring volume validation: A breakout without volume expansion has a much higher failure rate. Volume validates conviction.
Missing the macro context: A bull flag during an aggregate market downtrend has a lower continuation rate. Always evaluate patterns alongside the prevailing higher-timeframe trend.
Defining structural invalidation: Identify key pattern invalidation levels beforehand. If price violates the geometric boundary, the pattern is nullified.
Pattern Recognition with Diplyzer
Manually scanning for patterns across thousands of stocks is time-consuming. Diplyzer's pattern recognition engine identifies and validates patterns in real time:
AI Prompt
"Scan Nasdaq 100 Tech stocks ($10B+ market cap) with positive revenue growth for Cup and Handle or Bull Flag patterns completing on the daily chart in the last 2 weeks. Sort by pattern similarity score."
AI Prompt
"What chart pattern is [stock] forming right now? Identify key levels, measure the pattern dimensions, and calculate the textbook measured move projection."
AI Prompt
"Find all stocks currently breaking out of a multi-week base on volume above 150% of average. Filter for those with RS ratings above 80."
Pattern Cheat Sheet
| Pattern | Type | Structural Validation | Measured Move Projection |
|---|
| Bull Flag | Continuation | Resistance breakout with volume expansion | Flagpole height added to breakout level |
| Bear Flag | Continuation | Support breakdown with volume expansion | Flagpole height subtracted from breakdown level |
| Cup & Handle | Continuation | Pivot breakout on 2–3× average volume | Cup depth measured from rim pivot |
| Ascending Triangle | Continuation | Flat resistance breakout | Triangle height projected upward |
| Head & Shoulders | Reversal | Neckline breakdown | Head-to-neckline height projected downward |
| Double Top | Reversal | Intermediate trough breakdown | Peak-to-trough height projected downward |
| Double Bottom | Reversal | Intermediate peak breakout | Trough-to-peak height projected upward |
| Symmetrical Triangle | Continuation / Reversal | Boundary trendline breakout | Triangle height projected from breakout |
Start Pattern Analysis Now
Diplyzer identifies, validates, and quantifies chart patterns across thousands of symbols and multiple timeframes simultaneously.
AI Prompt
"Give me a complete pattern analysis of [stock]. Identify any current chart formations on the weekly and daily timeframes, measure the key levels, and summarize the geometric pattern dimensions and invalidation levels."