Support and resistance are the most fundamental concepts in all of technical analysis. Every other tool — indicators, chart patterns, volume analysis — is interpreted in the context of these levels. Understanding them is not optional: it is the bedrock of reading price action.
At their core, support and resistance describe zones where price has historically paused, reversed, or consolidated — and where it is likely to do so again in the future.
What Are Support and Resistance?
Support is a price level where buying pressure has historically been strong enough to halt a decline. It is the floor that catches falling price — the level where buyers step in with enough conviction to overwhelm sellers.
Resistance is a price level where selling pressure has historically been strong enough to halt a rally. It is the ceiling that caps rising price — the level where sellers emerge with enough conviction to overwhelm buyers.
The key insight: These levels are not magic lines on a chart. They are the accumulated memory of the market. Every trader who bought at a support level remembers it. Every trader who got trapped buying at a resistance level is waiting to sell when price returns there.
Supply and Demand Zones
When price reaches a level where a large number of institutional orders were previously executed, those institutions often remain interested in the same price:
- Institutions that bought at support: Will buy more if price returns there (demand)
- Institutions that sold at resistance: Will sell again if price returns there (supply)
- Trapped buyers at resistance: Will sell to break even when price returns (selling pressure)
Round Numbers
Human psychology anchors to round numbers — $50, $100, $200. Large option strikes are placed at round numbers. These create natural support and resistance levels across virtually every stock and index.
Prior Highs and Lows
The most important support and resistance levels are prior significant highs and lows. A prior 52-week high becomes the first major resistance on a breakout. A prior 52-week low becomes the first major support on a breakdown.
Types of Support and Resistance
Static (Horizontal) Levels
The most straightforward type — a specific price level that has acted as support or resistance multiple times.
How to identify them:
- Look for price levels where the market has reversed at least 2–3 times
- The more times a level has been tested, the more significant it is
- Stronger touches (decisive reversals) matter more than brief pauses
| Level Type | Signal Strength |
|---|
| Single touch | Low — may be coincidence |
| Double touch | Moderate — beginning of significance |
| Triple touch | High — institutionally significant |
| Four+ touches | Very high — major structural level |
Ask Diplyzer:
AI Prompt
"Map the key horizontal support and resistance levels for [stock] on the weekly and daily charts. Show me how many times each level has been tested."
Dynamic Levels (Trendlines)
Trendlines are diagonal lines drawn through a series of highs or lows as price moves directionally.
- Uptrend support line: Drawn through successive higher lows — price "bounces" off this line as long as the uptrend is intact
- Downtrend resistance line: Drawn through successive lower highs — price "rejects" at this line during a downtrend
Trendline rules:
- Needs at least two points to draw, three to confirm
- Steeper trendlines break more easily and carry less weight
- The longer a trendline has held, the more significant its eventual break
Moving Averages as Dynamic Support/Resistance
Major moving averages — particularly the 20-day EMA, 50-day SMA, and 200-day SMA — function as dynamic support and resistance because large institutions use them as benchmarks:
- 20-day EMA: Short-term momentum traders' reference; growth stocks often find support here during uptrends
- 50-day SMA: The institutional traders' moving average; a major inflection point for trend health
- 200-day SMA: Long-term investors' benchmark; stocks below the 200-day are technically in bear territory
Ask Diplyzer:
AI Prompt
"Is [stock] finding support or facing resistance at any key moving averages? Where are the 20-day EMA, 50-day SMA, and 200-day SMA relative to current price?"
Role Reversal: The Key Principle
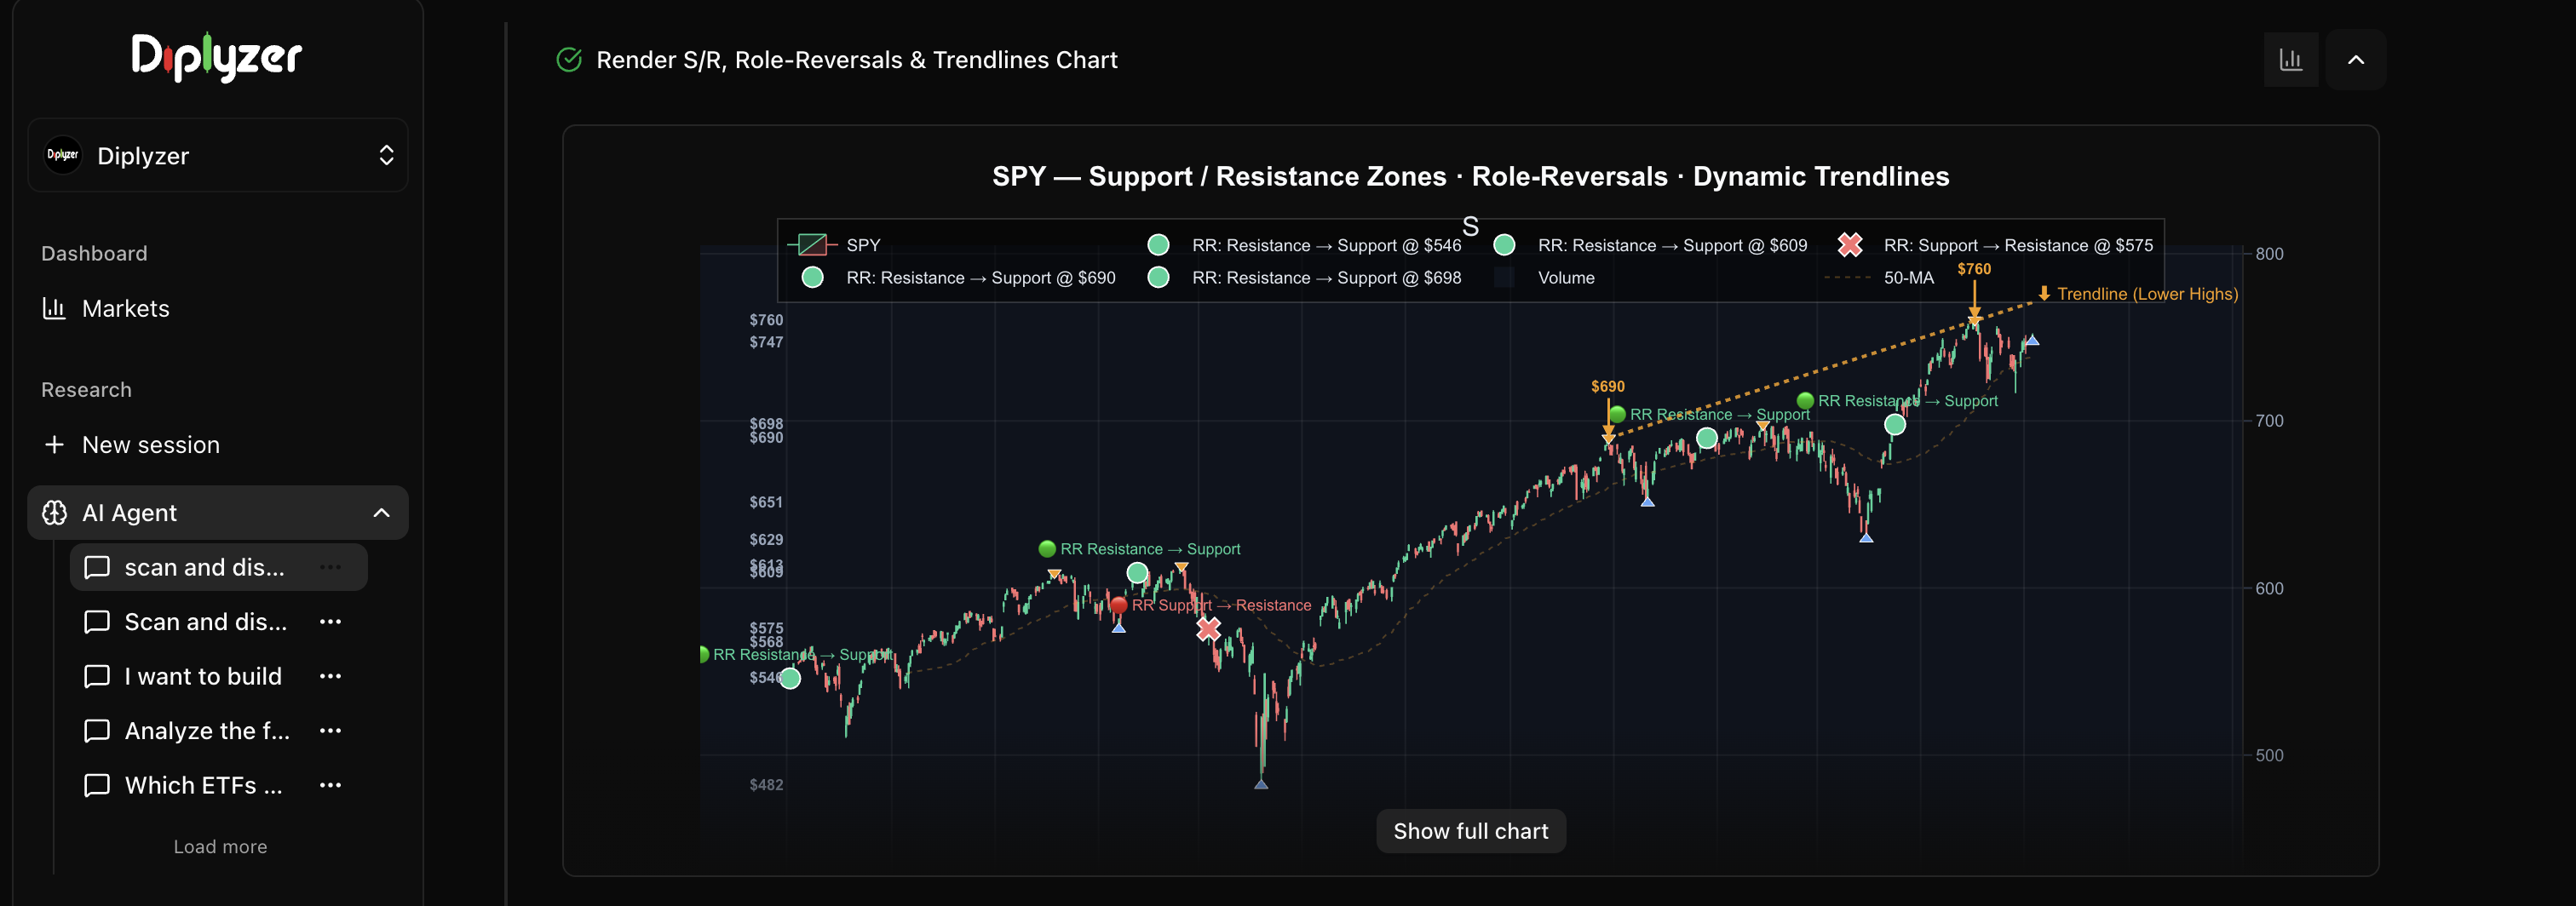
The most powerful phenomenon in support and resistance is role reversal: when a former support level becomes resistance after being broken, and vice versa.
Why it happens: When support is broken, the buyers who accumulated positions at that level are now underwater. When price rallies back to that level, they sell to exit at breakeven — converting the old support into new resistance.
The inverse: When resistance is broken, sellers who had been shorting at that level are now squeezed. If price pulls back to that level, they buy to cover — converting old resistance into new support.
In practice:
- A stock breaks below $50 support → $50 becomes resistance on any rally
- A stock breaks above $100 resistance → $100 becomes support on any pullback
- These role-reversal levels often provide the highest-probability entries in trending markets
AI Prompt
"What former support levels has [stock] broken below? Have any of those levels acted as resistance on subsequent rallies? Show me the key role-reversal zones."
Support and Resistance Zones vs. Lines
A common mistake is treating support and resistance as precise lines. In reality, they are zones — price clusters where activity has historically occurred.
For example, if a stock has touched $98, $99.50, and $100.20 before reversing each time, the resistance zone is approximately $98–$100.50 — not a precise $100.00.
Zone identification:
- Look at where wicks have clustered (not just closing prices)
- Consider the typical spread/volatility of the stock
- On higher-priced or more volatile stocks, zones should be wider
Support and Resistance in Context
Market Structure and Trend
Support and resistance only have meaning in the context of the prevailing trend:
- In an uptrend: Support levels are more reliable (buyers defend pullbacks); resistance levels are more likely to break
- In a downtrend: Resistance levels are more reliable (sellers cap rallies); support levels are more likely to break
- In a sideways market: Both support and resistance levels carry roughly equal weight
Volume Confirmation
A support or resistance level becomes far more significant when there is evidence of heavy volume activity at that price. If a large institutional buyer accumulated a position at $45, that level will be defended far more aggressively than a level where retail traders happened to buy.
Volume at price (VPVR or Volume Profile) is the most direct way to identify where institutional volume has been executed.
Price Action Dynamics at Key Levels
Support Bounces & Mean Reversion
In an established trend, pullbacks to significant historical support levels often encounter strong buying absorption:
- Price Behavior: Deceleration in downward candle size and lower wick rejections near the support zone
- Structural Invalidation: A decisive daily close below the support zone signals breakdown of the level
- Reference Targets: Subsequent historical resistance levels overhead
Breakout Mechanics
When price moves decisively through a long-standing resistance or support level:
- Confirmation Factor: Significant expansion in trading volume on the breakout candle validates institutional participation
- Structural Retest: Former resistance frequently acts as new support during initial pullbacks (role reversal)
- Measured Move Projections: Breakout distances often correlate geometrically with the height of the preceding consolidation base
False Breakouts (Liquidity Traps)
When price briefly breaks above resistance or below support, then rapidly reverses back inside the range — this represents a liquidity sweep:
- Bull trap: Price briefly penetrates resistance, triggers breakout orders, then drops sharply back into the range
- Bear trap: Price briefly penetrates support, sweeps stop orders, then recovers sharply back above the level
Mapping Levels with Diplyzer
AI Prompt
"Give me a full support and resistance map for [stock] on the daily chart. Identify the three most significant levels above current price and the three most significant below. Show volume at each level."
AI Prompt
"Where is [stock] in relation to its 52-week high and low? What are the key resistance levels between current price and the 52-week high?"
AI Prompt
"Has [stock] broken below any major support levels in the last 30 days? Have those broken supports turned into resistance?"
Key Takeaways
- Support and resistance are not magic lines — they are zones of accumulated supply and demand
- The more times a level is tested, the more structurally significant it becomes
- Role reversal (support becomes resistance after a break, and vice versa) is one of the most reliable structural patterns in technical analysis
- Always evaluate support and resistance in conjunction with broader market trend direction
- Volume confirms the structural significance of every level