Price tells you what is happening. Volume tells you why — and more importantly, how serious it is.
A stock that rises 5% on triple the average volume is a fundamentally different event than the same 5% rise on below-average volume. In the first case, conviction is high and institutions are engaged. In the second, the move could be thin-market noise that evaporates as quickly as it appeared.
Volume is the engine behind price action. Learning to read it is one of the most underutilized edges available to analysts and researchers.
What Volume Reveals
Volume measures the number of shares (or contracts) traded over a given period. High volume means many participants are actively engaged at the current price. Low volume means indifference.
The core principle: Volume validates or questions every price move.
| Price Action | Volume | Interpretation |
|---|
| Price rises | High | Strong bullish conviction — institutions buying |
| Price rises | Low | Weak advance — may not be sustainable |
| Price falls | High | Strong bearish conviction — institutional selling |
| Price falls | Low | Weak pullback — likely a healthy correction |
| Breakout up | High | Valid breakout — confirmed by institutional participation |
| Breakout up | Low | Suspect breakout — high risk of failure |
| Breakdown down | High | Valid breakdown — heavy distribution |
| Breakdown down | Low | False breakdown — potential trap |
The Relationship Between Volume and Trend
Volume Confirms Trend Health
In a healthy uptrend, price should advance on above-average volume and pull back on below-average volume. This pattern tells you that buyers are more aggressive than sellers — institutions are accumulating on strength and are not concerned by temporary dips.
Signs of a healthy uptrend:
- Up days (green candles) have higher volume than down days (red candles)
- Pullbacks are on low volume — sellers are not panicking
- Breakouts from consolidation occur on 2–3× average volume
Signs the trend is weakening:
- Up days have declining volume even as price continues rising
- Down days start showing higher volume than up days
- The stock rallies but can't attract the volume it used to
Climax Runs and Exhaustion
When a stock that has been in a long uptrend suddenly accelerates sharply with enormous volume — often 5–10× normal — this is called a climax top or volume exhaustion.
This extreme volume signals that buying enthusiasm has reached a peak. With limited incremental buyers left, even modest selling can push price lower dramatically.
What to watch for:
- The largest volume bar in the entire trend
- Price gaps up dramatically and closes in the middle or lower half of the range
- The stock reverses sharply the following days on continued high volume
AI Prompt
"Has [stock] shown any climax volume patterns recently? Is there evidence of volume exhaustion after a sustained uptrend?"
Accumulation and Distribution
Accumulation is the process of institutional investors building large positions over time — buying shares quietly without pushing price up dramatically.
Distribution is the reverse — institutions quietly selling large positions before a significant price decline.
Both processes take time — large institutions can't buy or sell millions of shares in a single session. The evidence accumulates over days and weeks.
Signs of Accumulation
- Repeated high-volume up days followed by low-volume pullbacks
- The stock holds above support levels despite negative news
- Rising On-Balance Volume (OBV) while price trades sideways
- Shakeouts: Brief drops below support that quickly recover — institutions use these to absorb liquidity and accumulate at lower prices
Signs of Distribution
- High-volume down days with weak recovery attempts
- Price fails to make new highs despite multiple attempts
- Declining OBV even as price holds near highs
- Stall days: A stock barely moves despite high volume — institutions are quietly selling into the demand
AI Prompt
"Show me the volume pattern for [stock] over the last 3 months. Is the price action showing signs of accumulation or distribution? What does the OBV tell us?"
On-Balance Volume (OBV)
On-Balance Volume, developed by Joe Granville, is the most widely used volume-based indicator. It tracks cumulative volume: adding the day's volume when price closes up, subtracting it when price closes down.
OBV is a leading indicator: It often diverges from price before a major move.
OBV Divergences
Bullish divergence: Price makes a new low but OBV fails to make a new low. More volume is flowing in on up days than out on down days — an early indicator of potential upward momentum.
Bearish divergence: Price makes a new high but OBV fails to make a new high. Volume on up days is weakening even as price continues to rise — a warning indicator of potential trend deceleration.
AI Prompt
"What is the OBV trend for [stock]? Does OBV confirm the price trend or is there a volume divergence indicating trend deceleration?"
Volume Profile
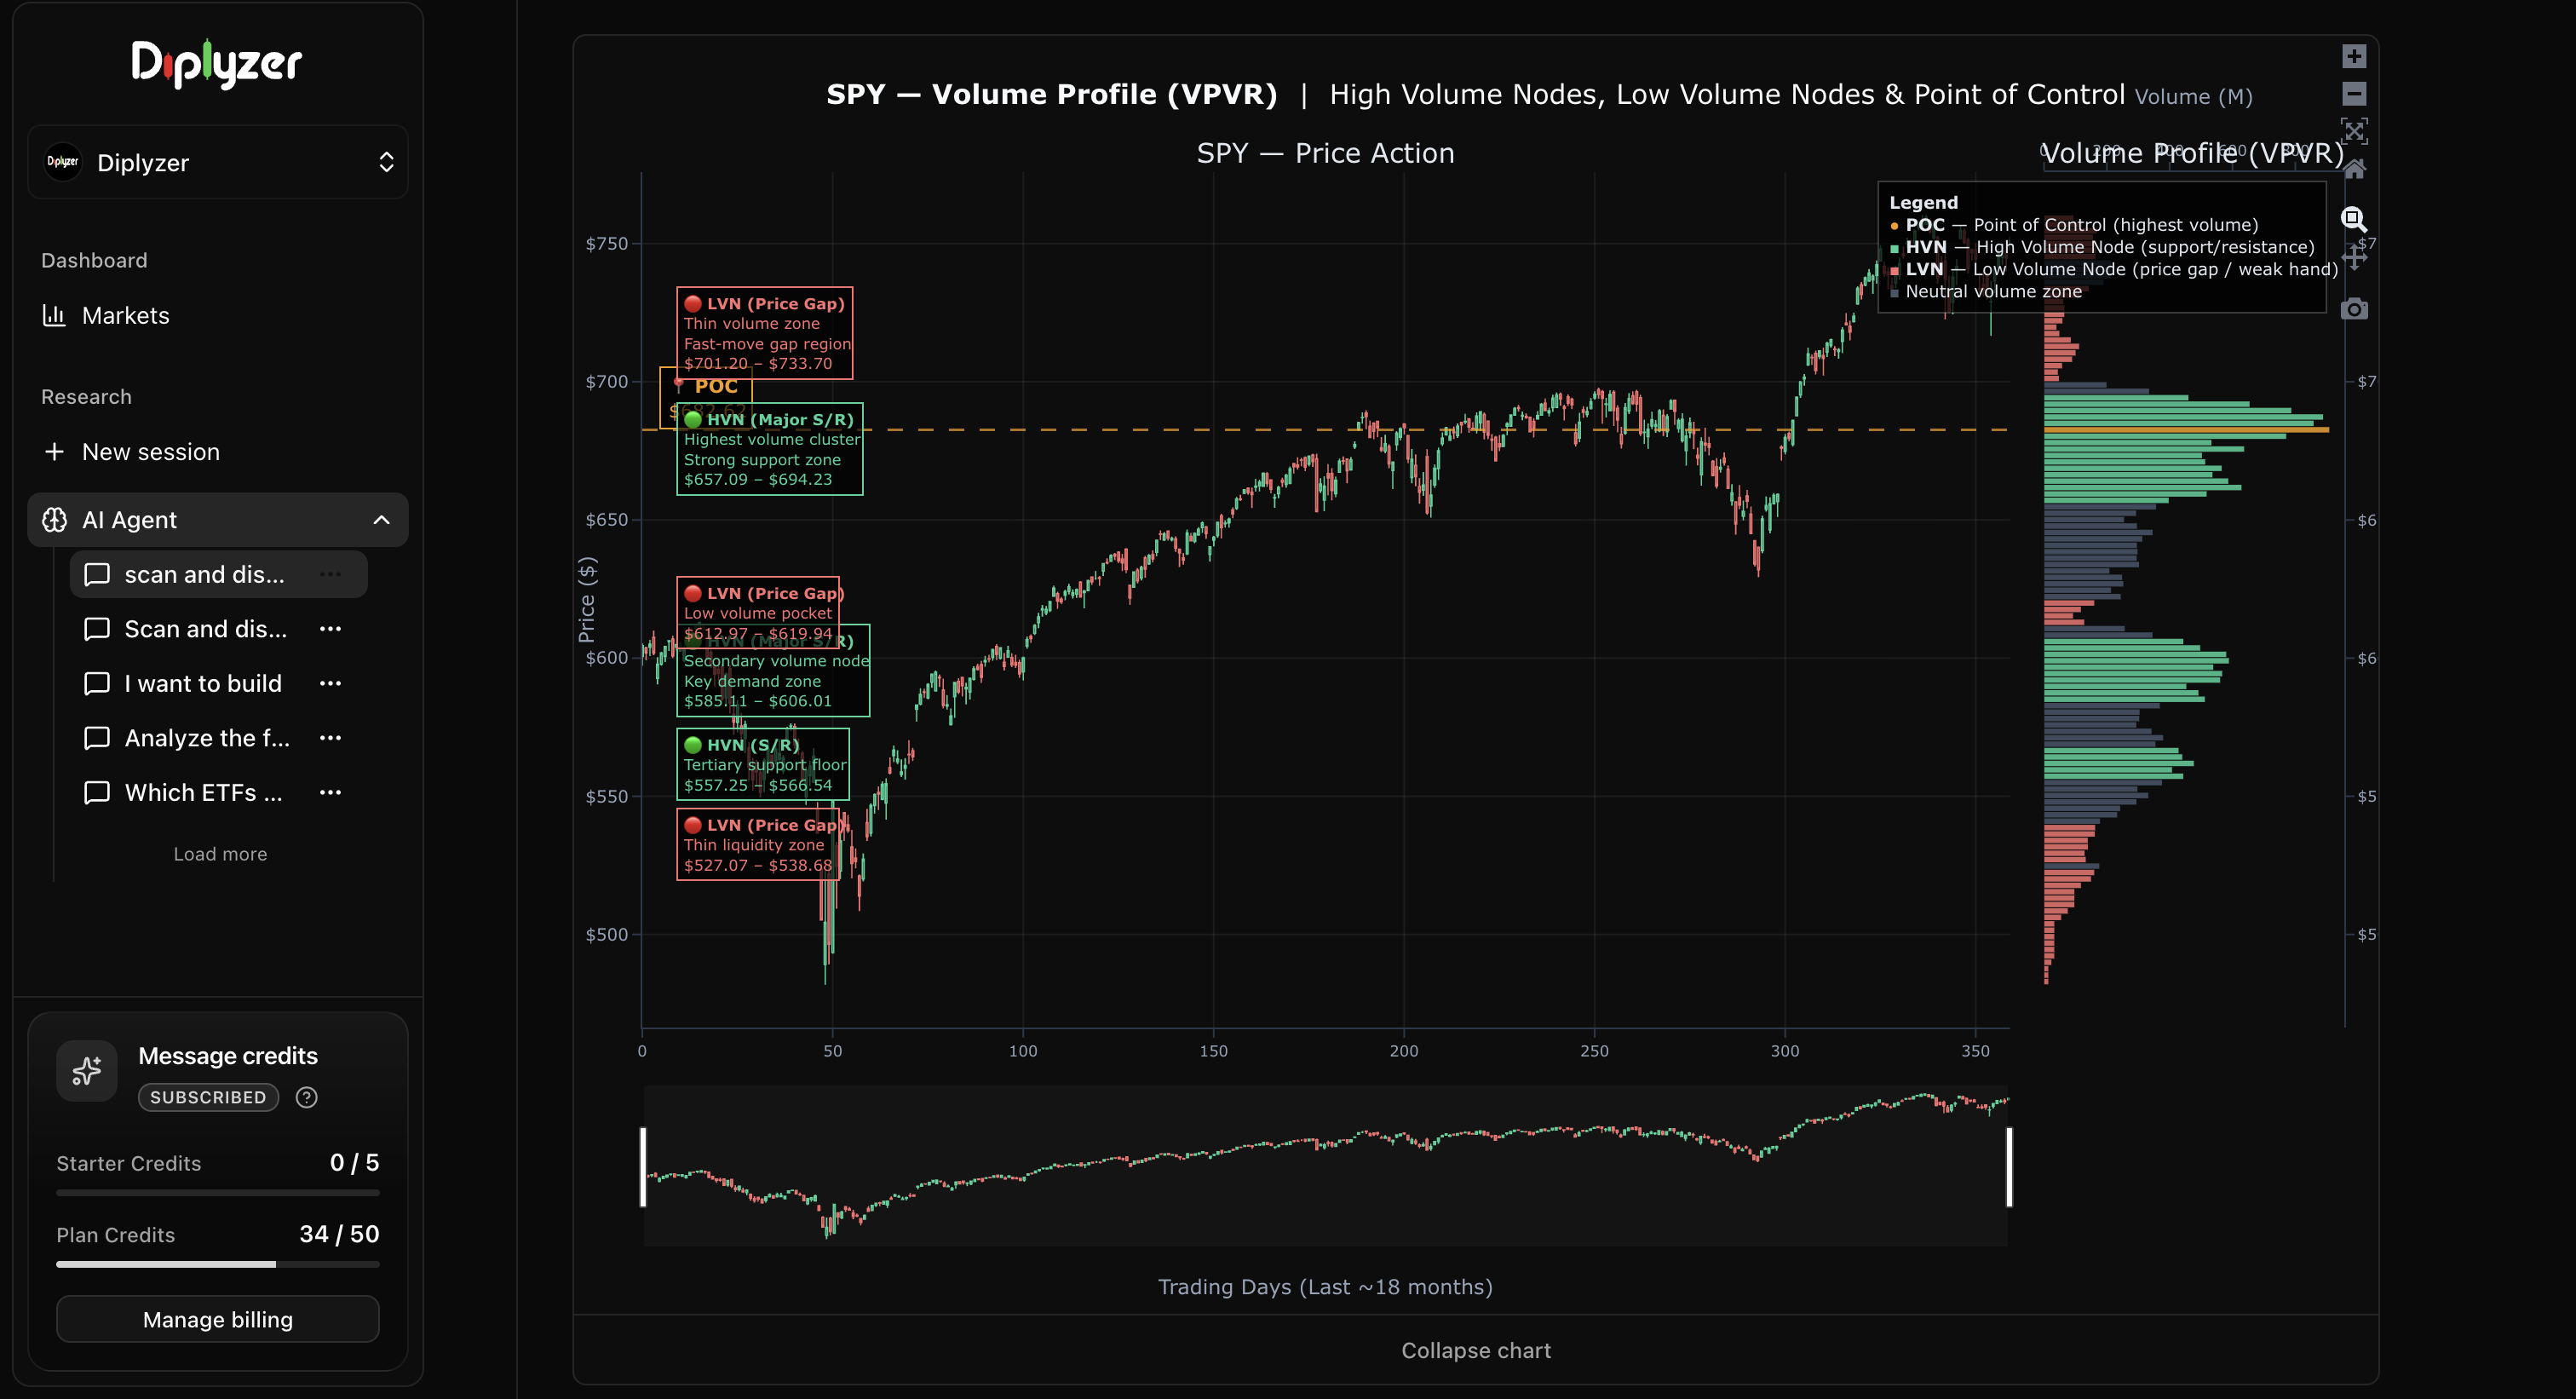
Volume Profile (also called VPVR — Volume Profile Visible Range) maps the volume traded at each price level over a given period, creating a horizontal histogram alongside the price chart.
This reveals:
- High Volume Nodes (HVN): Price levels where enormous volume was traded — these become strong support/resistance because institutions have large positions here
- Low Volume Nodes (LVN): Price gaps in the volume distribution — price tends to move quickly through these levels since there is little trading interest there
- Point of Control (POC): The single price level with the most volume — the market's "fair value" for that period
Practical applications:
- When price is at a Low Volume Node, expect fast movement until it reaches a High Volume Node
- The Point of Control is often a mean-reversion level for price after an extended move
- Breakouts through High Volume Nodes require substantially more volume to sustain
AI Prompt
"Show me the Volume Profile for [stock] over the last 6 months. Where are the major High Volume Nodes and Low Volume Nodes? What is the Point of Control?"
Volume on Chart Patterns
Every chart pattern should be validated with volume:
Volume and Breakouts
The core volume validation principle: any breakout from a base typically occurs on above-average volume. The standard threshold is at least 40–50% above the 50-day average volume; exceptional breakouts often see 2–3× or more.
A breakout on low volume has a dramatically higher failure rate. Institutional buyers either aren't present or aren't convinced — without their support, the breakout will likely fail.
Volume and Pullbacks
During a base-building period (before a breakout), pullbacks should occur on declining volume. This indicates that selling pressure is weak and that sellers aren't panicking — a bullish sign.
Volume and Reversals
Reversal patterns like head and shoulders or double tops are significantly more reliable when accompanied by high volume on the breakdown and declining volume on subsequent recovery attempts.
Common Volume Patterns
Volume Dry-Up (VDU)
An extreme contraction in volume, often to 50% or less of average. This signals that selling volume has decelerated and that liquidity is drying up before a potential volatility expansion.
Shakeout on Volume
A sudden, sharp decline on high volume that quickly reverses and reclaims the lost ground. This is a characteristic price movement where large participants absorb supply at key support levels.
The rapid recovery is the tell: if real selling pressure existed, the stock wouldn't bounce so quickly.
Up on Volume, Down on Volume
Track the ratio of average up-day volume to average down-day volume over a 10-day period. When up days consistently show higher volume than down days, net volume flow is positive.
Analyzing Volume with Diplyzer
AI Prompt
"Analyze the volume pattern for [stock] over the last 90 days. Are there signs of institutional accumulation or distribution? Are up days showing more volume than down days?"
AI Prompt
"Has there been any unusual volume activity on [stock] recently — either a climax run, a high-volume reversal, or a volume dry-up? How does this volume behavior align with the current trend structure?"
AI Prompt
"Compare [stock]'s current volume levels to its 50-day average. Is the recent price action being confirmed by strong volume or is it happening on weak participation?"
The Core Rule of Volume
Always evaluate market structure in conjunction with volume. Technical price indicators — support tests, resistance rejections, chart pattern breakouts, trendline moves — are significantly more robust when validated by volume metrics.
Price is what you see. Volume is what validates the move.