Volatility is the heartbeat of the market. Without it, there would be no opportunity — prices would never move enough to generate trading profits. But too much volatility, misjudged and unmanaged, is how most traders lose money.
Volatility indicators don't tell you which direction price will move. They tell you how much price is likely to move, and whether the current environment is compressed (energy building) or expanded (energy releasing). That context is essential for timing entries, setting stops, and sizing positions intelligently.
Why Volatility Matters for Traders
Understanding volatility gives you three core advantages:
- Entry timing: Volatility expands after compression. Trading breakouts from low-volatility environments dramatically improves your accuracy
- Stop placement: If a stock moves an average of $2 per day, a $0.50 stop will be triggered by noise. ATR-based stops are sized to the actual rhythm of the stock
- Position sizing: High volatility = smaller position sizes to control dollar risk. Low volatility = larger position sizes to earn meaningful returns
Bollinger Bands
Bollinger Bands, developed by John Bollinger, are a volatility envelope placed around a central moving average. They consist of:
- Middle Band: A 20-period simple moving average (SMA)
- Upper Band: 2 standard deviations above the middle band
- Lower Band: 2 standard deviations below the middle band
The bands automatically widen when volatility increases and contract when volatility decreases. This means the bands themselves are a visual representation of market volatility state.
The Squeeze: Volatility Compression
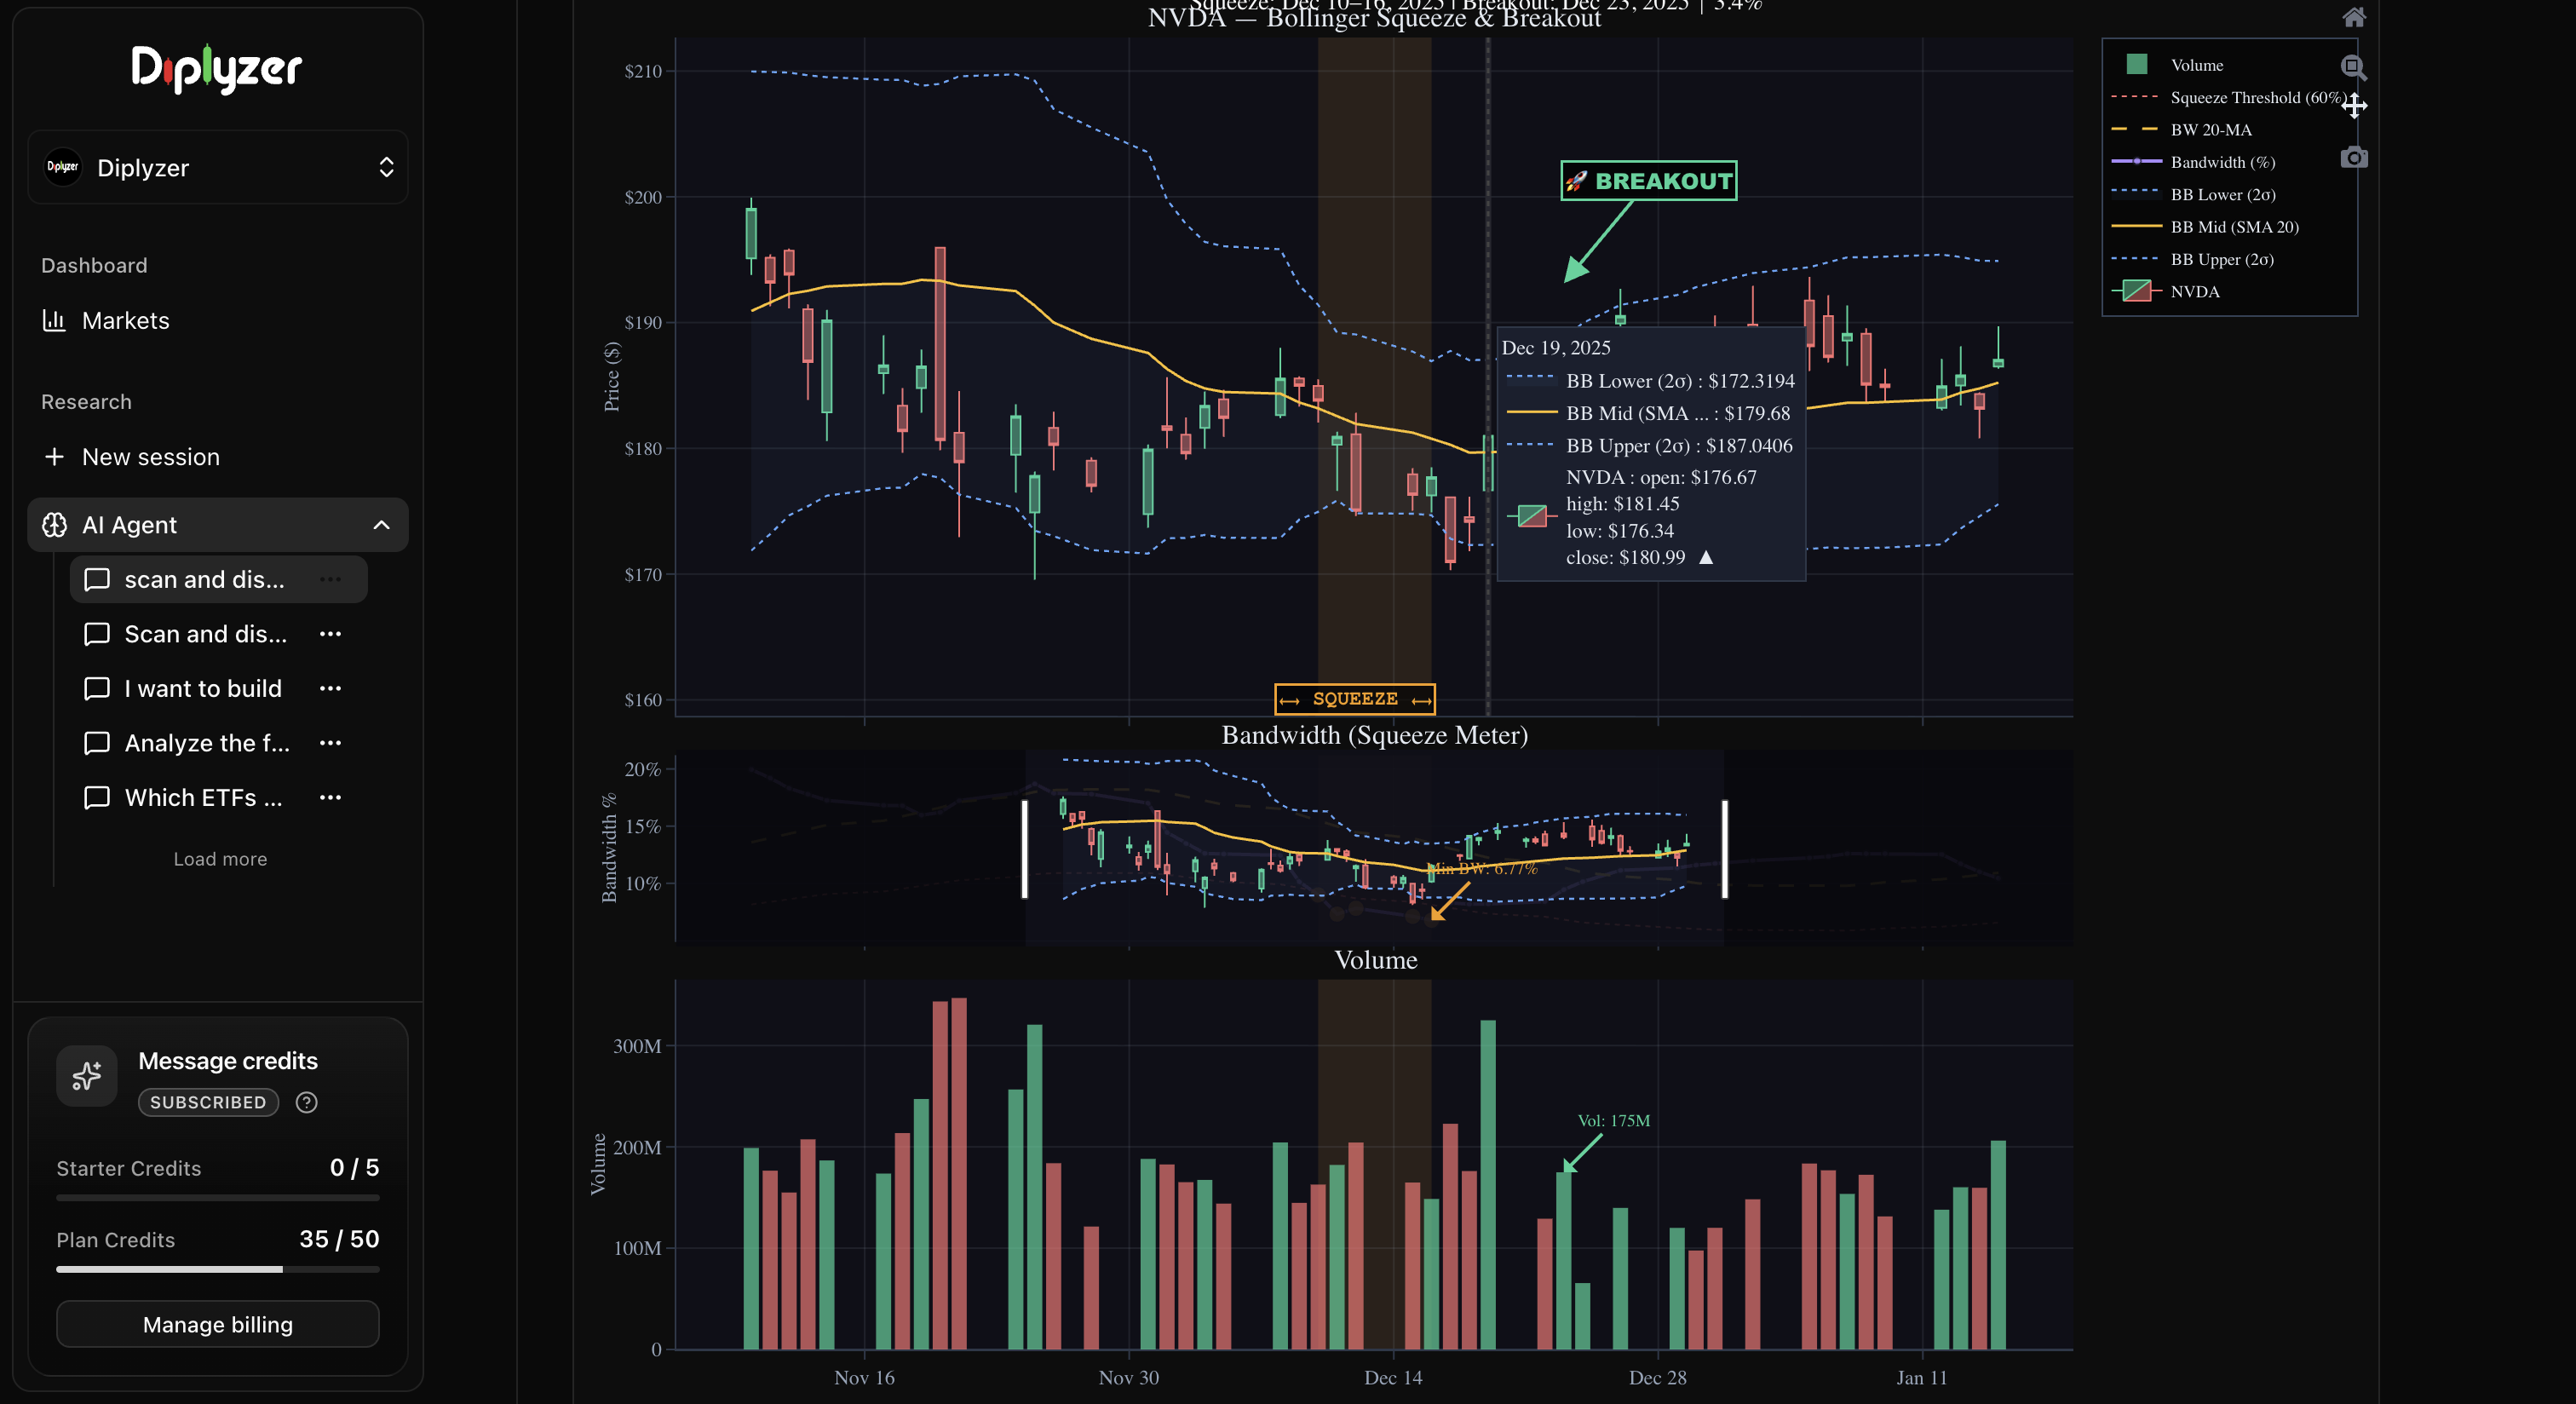
The most actionable signal from Bollinger Bands is the Bollinger Band Squeeze — when the bands compress to their narrowest width in months. This signals that volatility has contracted significantly, and history shows that extreme compression is almost always followed by extreme expansion.
The squeeze doesn't tell you the direction — it tells you that a major move is imminent.
How to trade the squeeze:
- Identify a squeeze: the bands are at their narrowest in the past 6 months
- Wait for the breakout: a decisive close outside either band
- Enter in the direction of the breakout with a stop inside the band
- Ride until price reaches the opposite band (common target) or shows reversal signals
AI Prompt
"Is [stock] currently in a Bollinger Band Squeeze? How tight are the bands relative to the past 6 months, and what's the expected volatility expansion range?"
Band Walking
In a strong trend, price can "walk" along the upper (or lower) Bollinger Band for extended periods. This is a sign of exceptional momentum — the stock keeps closing above the upper band despite it expanding.
What it means:
- Walking the upper band: Strong bullish momentum; don't short just because the stock is "overbought"
- Walking the lower band: Strong bearish momentum; don't buy just because the stock is "oversold"
Bollinger Band Width
Bollinger Band Width (BBW) is a derived indicator that measures the width of the bands as a percentage of the middle band. It makes it easier to compare volatility states across different time periods and different stocks.
BBW near historical lows: Volatility contraction — expect a major move BBW near historical highs: Volatility expansion at extremes — potential exhaustion ahead
Average True Range (ATR)
Average True Range, developed by J. Welles Wilder, measures the actual volatility of a stock by calculating the average range (high minus low) over a given period, accounting for gaps.
The "true range" for each day is the maximum of:
- Current high minus current low
- Current high minus previous close
- Current low minus previous close (absolute value)
ATR is typically calculated over 14 periods.
ATR in Practice
ATR does not indicate direction — it only measures magnitude of movement. A stock with an ATR of $5 moves an average of $5 per day.
Key uses:
Stop placement: A common method is the 2–3× ATR stop — placing your stop loss 2–3 average daily ranges below your entry. This ensures your stop won't be hit by normal daily noise.
| ATR Multiplier | Use Case |
|---|
| 1× ATR | Tight stop — day trading, high-conviction setups |
| 2× ATR | Standard stop — swing trading |
| 3× ATR | Wide stop — accommodating volatile stocks or avoiding shakeouts |
Position sizing with ATR: Define your maximum dollar risk per trade (e.g., 1% of portfolio). Divide that by your ATR-based stop distance to determine share size.
AI Prompt
"What is the 14-day ATR for [stock]? Calculate the mathematical position size for a $500 risk limit using a 2× ATR threshold."
Identifying low-volatility setups: When ATR contracts significantly relative to its historical range, the stock is "coiling" — building energy for a larger move. These are often the best entry points for directional trades.
ATR Trailing Stops
An ATR trailing stop moves with price: it is set at a fixed multiple of ATR below the highest price reached during the trade. It only moves in the direction of the trade — never against it.
This lets winners run while cutting losses if the stock gives back too much ground.
The VIX: Fear & Complacency in the Market
The VIX (CBOE Volatility Index), often called the "Fear Index," measures the market's expectation of S&P 500 volatility over the next 30 days — derived from the pricing of S&P 500 options.
- VIX below 15: Low volatility, complacent market — potential for sudden spikes
- VIX 15–25: Normal market volatility
- VIX 25–40: Elevated fear — increased market uncertainty
- VIX above 40: Extreme fear — typically associated with market crises or crashes
Contrarian Use of the VIX
The VIX is a mean-reverting indicator. Extreme readings in either direction tend to revert to the mean:
High VIX (extreme fear): Markets are often bottoming or near a bottom. When everyone is panicking, the best buyers are often the contrarians who buy fear. A VIX spike above 40 has historically been a reliable signal that a market low is near.
Low VIX (extreme complacency): Markets are vulnerable. When no one fears volatility, they are often under-positioned for protection. A VIX below 12 signals a market potentially overdue for a correction.
AI Prompt
"What is the current VIX level? How does it compare to its 1-year and 5-year historical percentiles, and what has this volatility regime historically implied for 30-day index realized volatility?"
Historical Market Volatility Regimes
When VIX is elevated (above 25):
- Market-wide daily price ranges expand significantly
- Statistical standard deviation of returns increases
- Historical drawdowns show elevated correlation across equities
When VIX is compressed (below 15):
- Daily trading ranges tighten
- Implied options volatility is historically priced lower
- Markets often transition into prolonged low-volatility trend regimes
Combining Volatility Indicators
The real power comes from using these quantitative tools together:
The Squeeze: An asset with a Bollinger Band Squeeze (compressed BBW), an ATR at 12-month lows, and the broader VIX at low levels represents maximum historical compression. When volatility expands, directional momentum often follows with exceptional force.
Quantitative Volatility Framework: ATR provides a mathematical measure of expected price range. Bollinger Bands quantify deviation from the mean, and the VIX measures aggregate market-implied variance.
AI Prompt
"Give me a complete volatility analysis for [stock]. What are the Bollinger Band width and squeeze status, the current ATR versus its 3-month average, and how does current volatility compare to historical ranges? Calculate the mathematical 2× ATR threshold from the current price."
Volatility Research Checklist
When conducting volatility analysis, evaluate:
- [ ] Is current ATR calculated relative to historical ranges?
- [ ] Is the asset in a Bollinger Band volatility squeeze (bandwidth compression)?
- [ ] Are price bands expanding (trend initiation) or contracting (consolidation)?
- [ ] What is the current VIX implied volatility percentile?
- [ ] Do volatility metrics confirm the underlying technical structure?
Low volatility precedes expansion. High volatility precedes mean reversion. Quantifying volatility is the foundation of institutional risk modeling.